


Power BI for manufacturing and distribution: transform complicated numbers into business impact
Turn complex data into actionable insights with dashboards directly in Dynamics 365 Business Central and CRM, helping manufacturers and distributors make, move and sell faster and smarter
What is Microsoft Power BI?
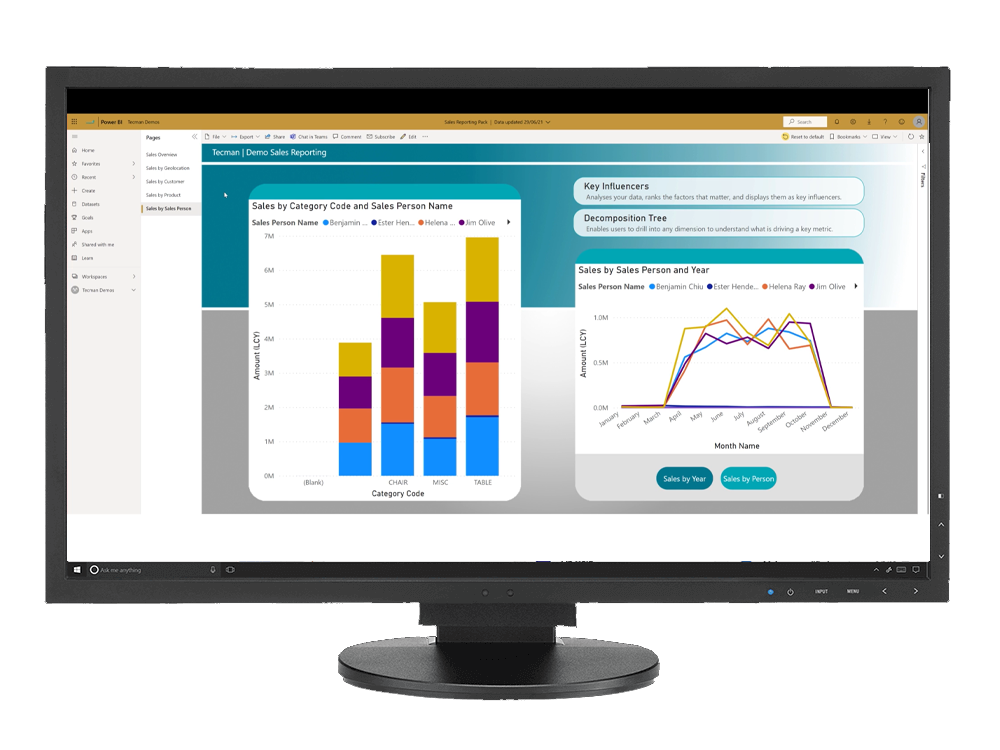
Power BI – part of Microsoft Power Platform – is a reporting tool that transforms complicated numbers into visualisations, graphs and dashboards, all to help you make the best decisions for your business.
Power BI connectors to Microsoft Dynamics 365 Business Central and CRM centralise reporting. And with more than 70 pre-built reports for you to choose from, Power BI’s strong visualisations make it much easier to digest your data and get insights and information that you can act on.
Power BI for manufacturing and distribution
Power BI is a powerful tool (pun definitely intended!) that can support people in umpteen different roles across manufacturing and distribution.
Whether you’re on the factory floor, in the warehouse, or behind the scenes in finance, operations or sales and marketing, Power BI is guaranteed to do one thing: help you make impactful decisions that take your business in the right direction. Choose your area below to understand how it can work for you.
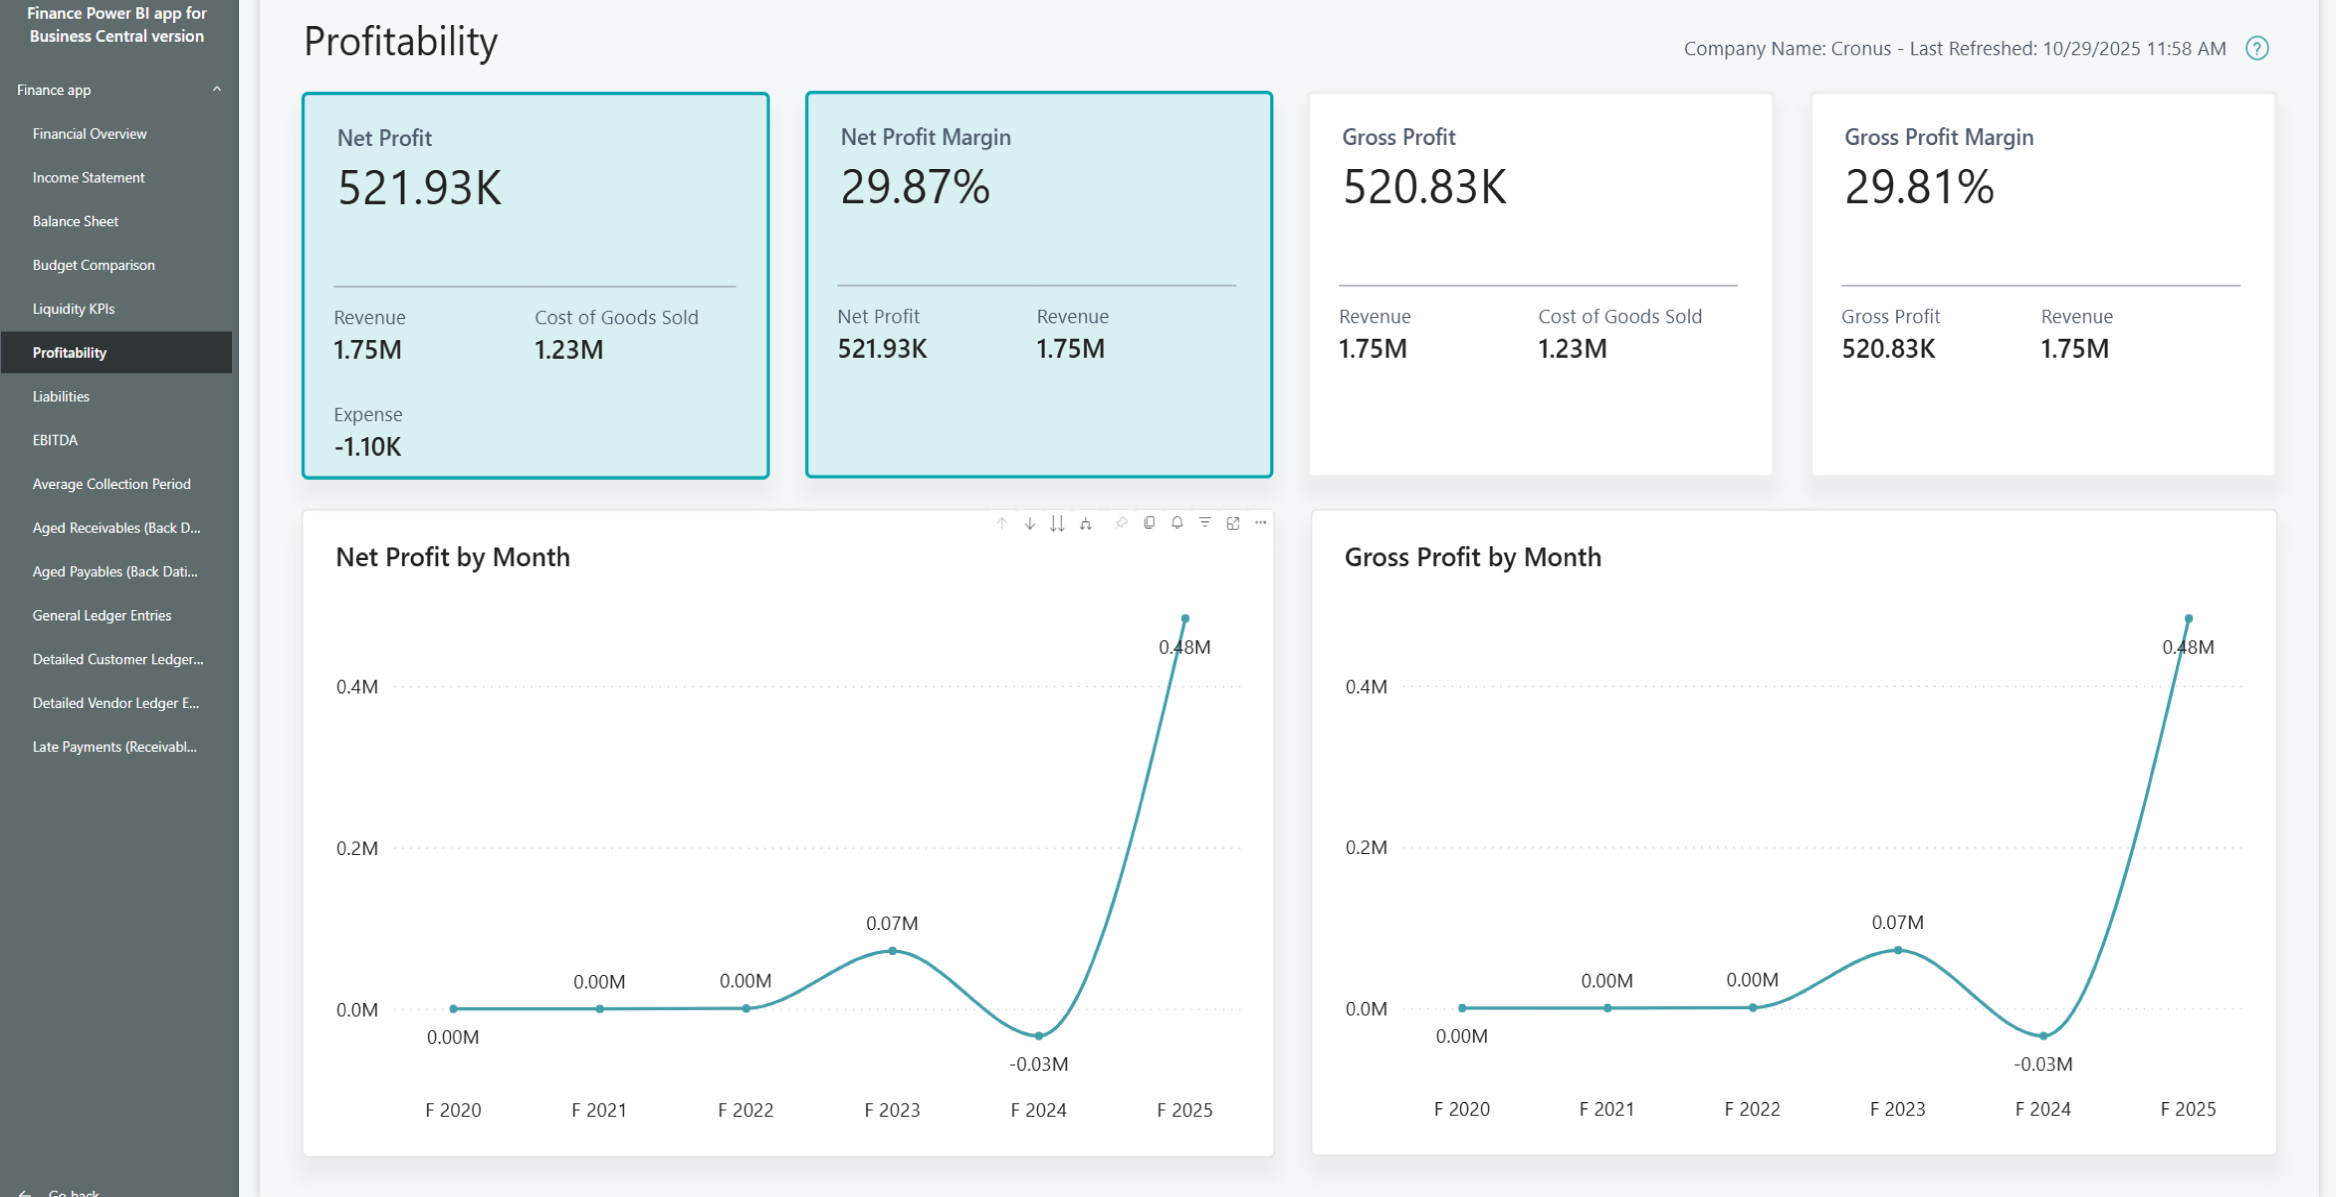
Boost profitability with full financial visibility
Power BI pulls data straight from Business Central, giving you visibility of important metrics and KPIs, from cash flow to raw material usage and recently captured stock levels. Use this insight to spot cost overruns, avoid overstocking and shortages and more, helping maximise your profit margins.
Plan and prepare more effectively by connecting the dots with your data
Combine Dynamics 365 CRM sales pipeline data with Business Central financials to forecast revenue more accurately and make sure you’re ready to cope with the peaks and troughs of seasonal demand.
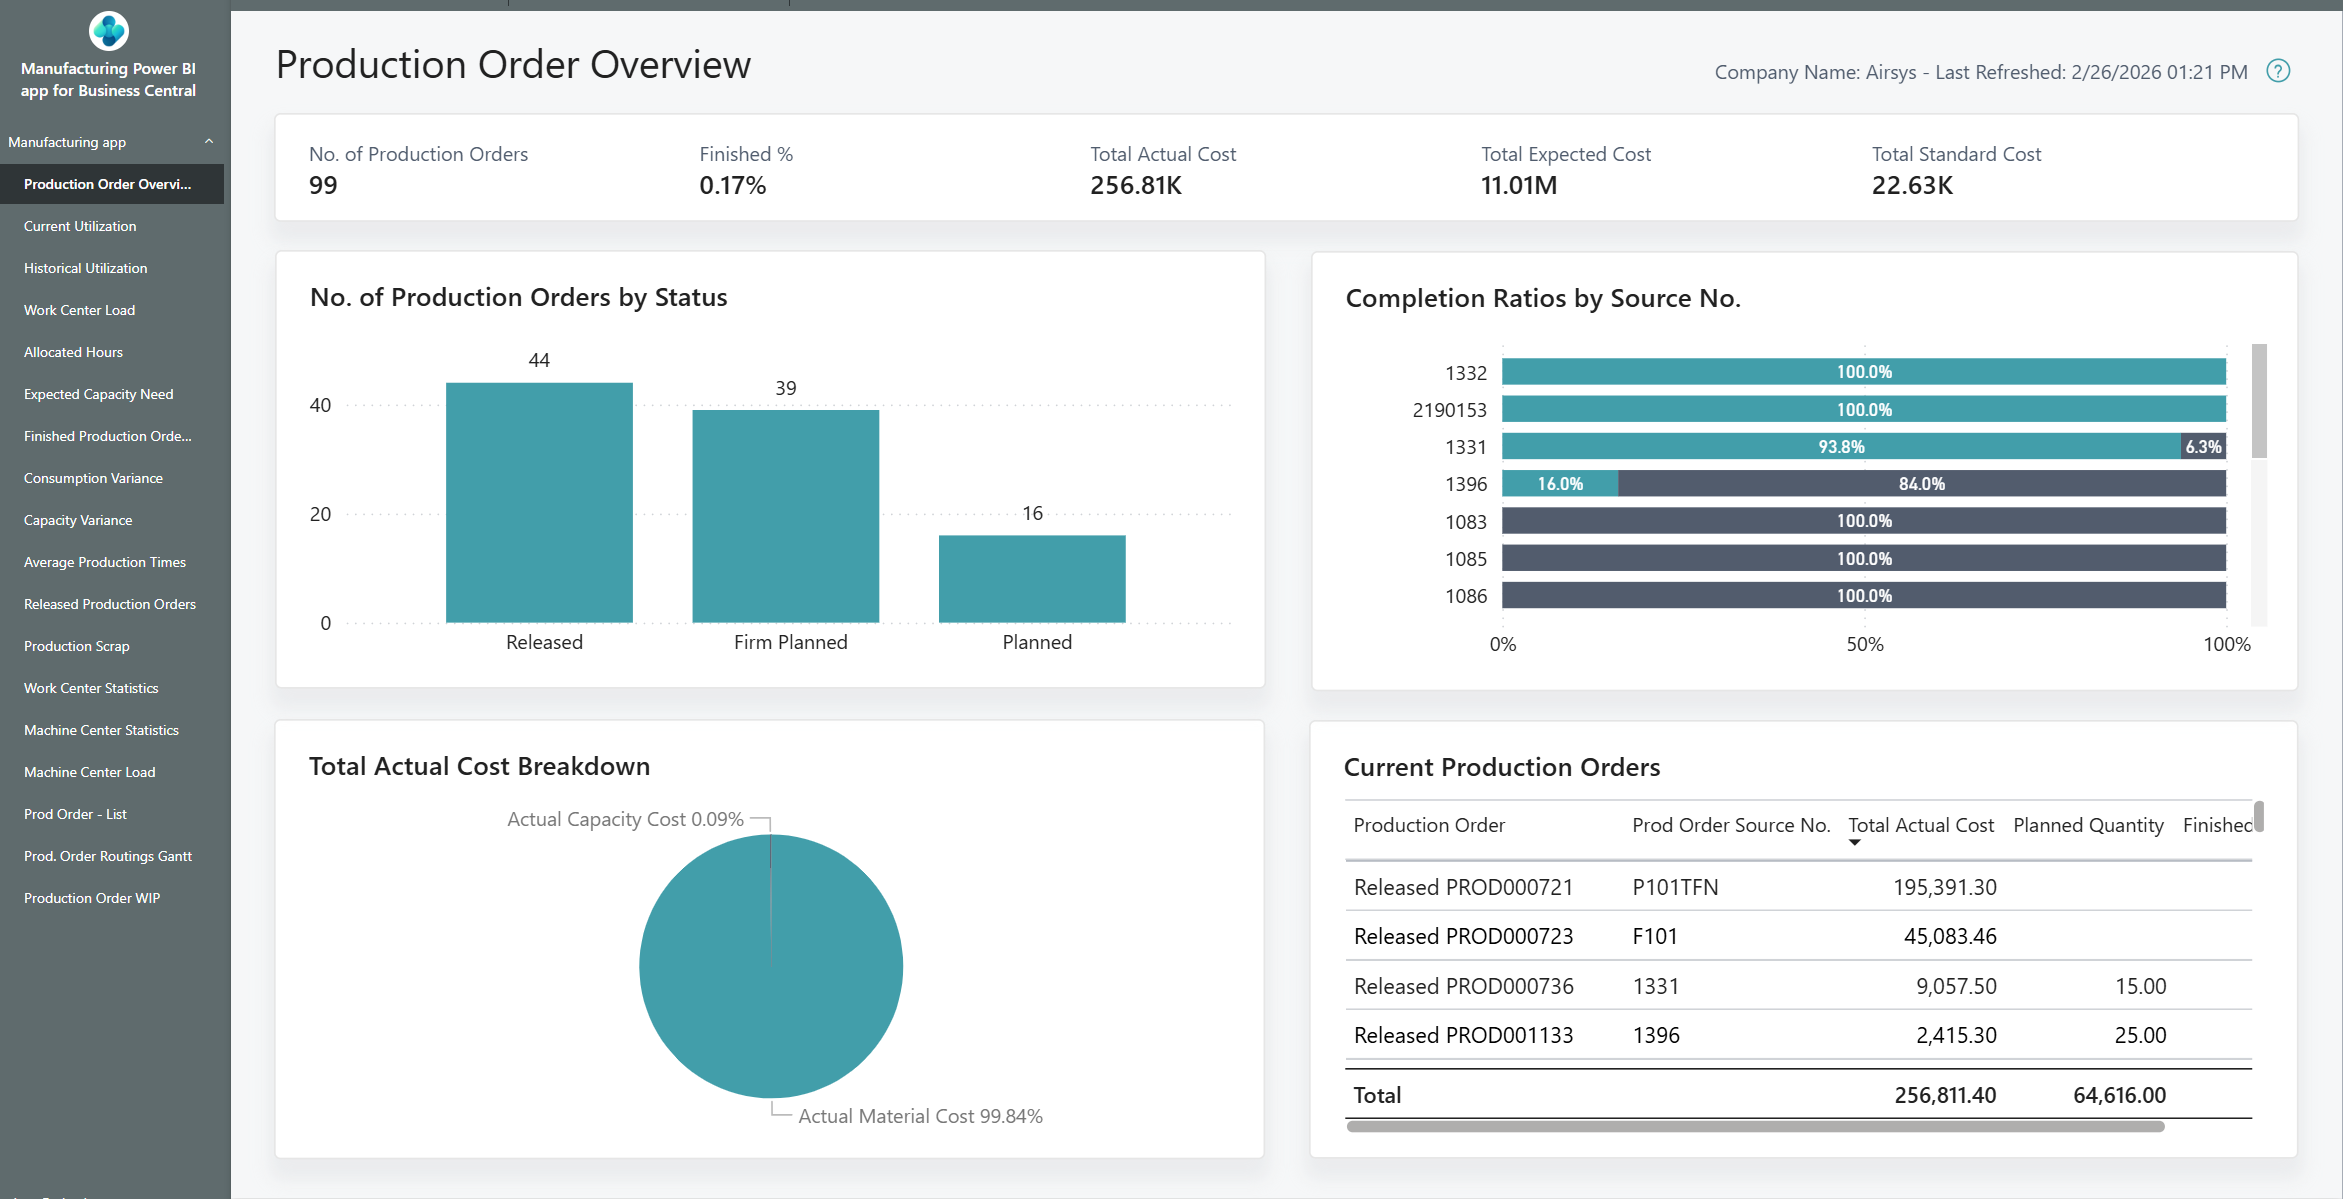
Save time (and stress!) with automated reports and role-based dashboards
Power BI dashboards update dynamically, so you can quickly pull up-to-date data for monthly management packs. Meanwhile, custom reports let you cherry-pick the information that matters to you most. Whether it’s expected vs actual production costs or real-time profit margins, drill down into the data you need without digging for hours first.

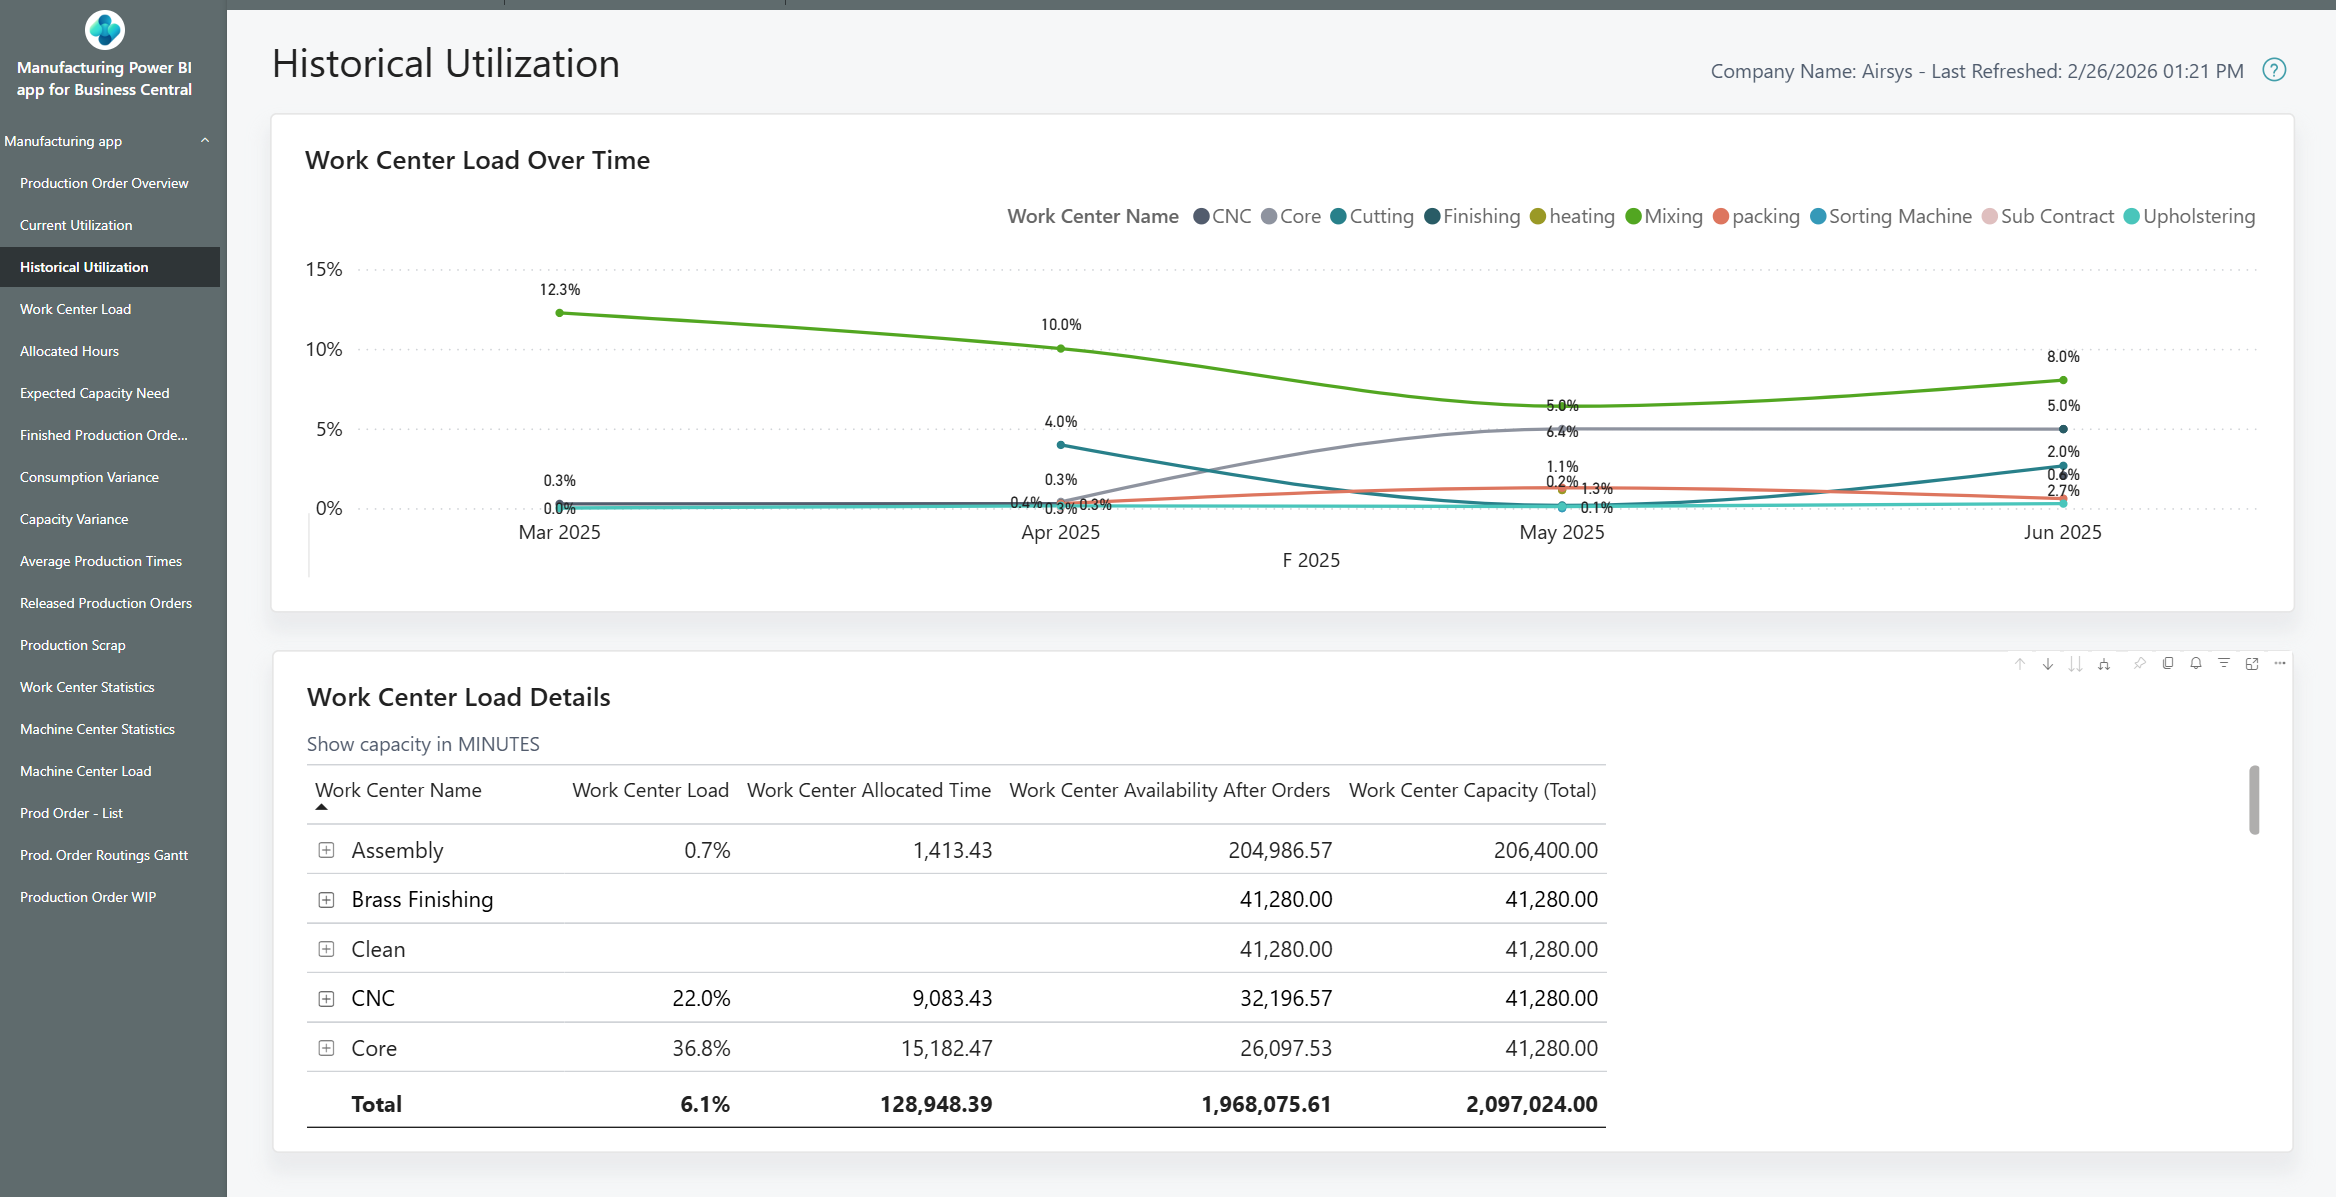
Cut wasted costs with enhanced inventory management and demand forecasting
Power BI combines current and historical data from your Business Central system to paint a fuller picture of your business performance. Keep a closer eye on stock levels and use the insights you uncover to forecast demand more accurately, avoid over- and under-stocking and reduce unnecessary spend.
Introduce more efficient ways of working in the warehouse
Connecting Power BI to Business Central makes it much easier to spot trends and use data to support better decision-making in the warehouse. From optimising picking routes to help deliver more in less time, to tracking picking and shipping KPIs on warehouse screens, spot inefficiencies and drive improvement for your warehouse.
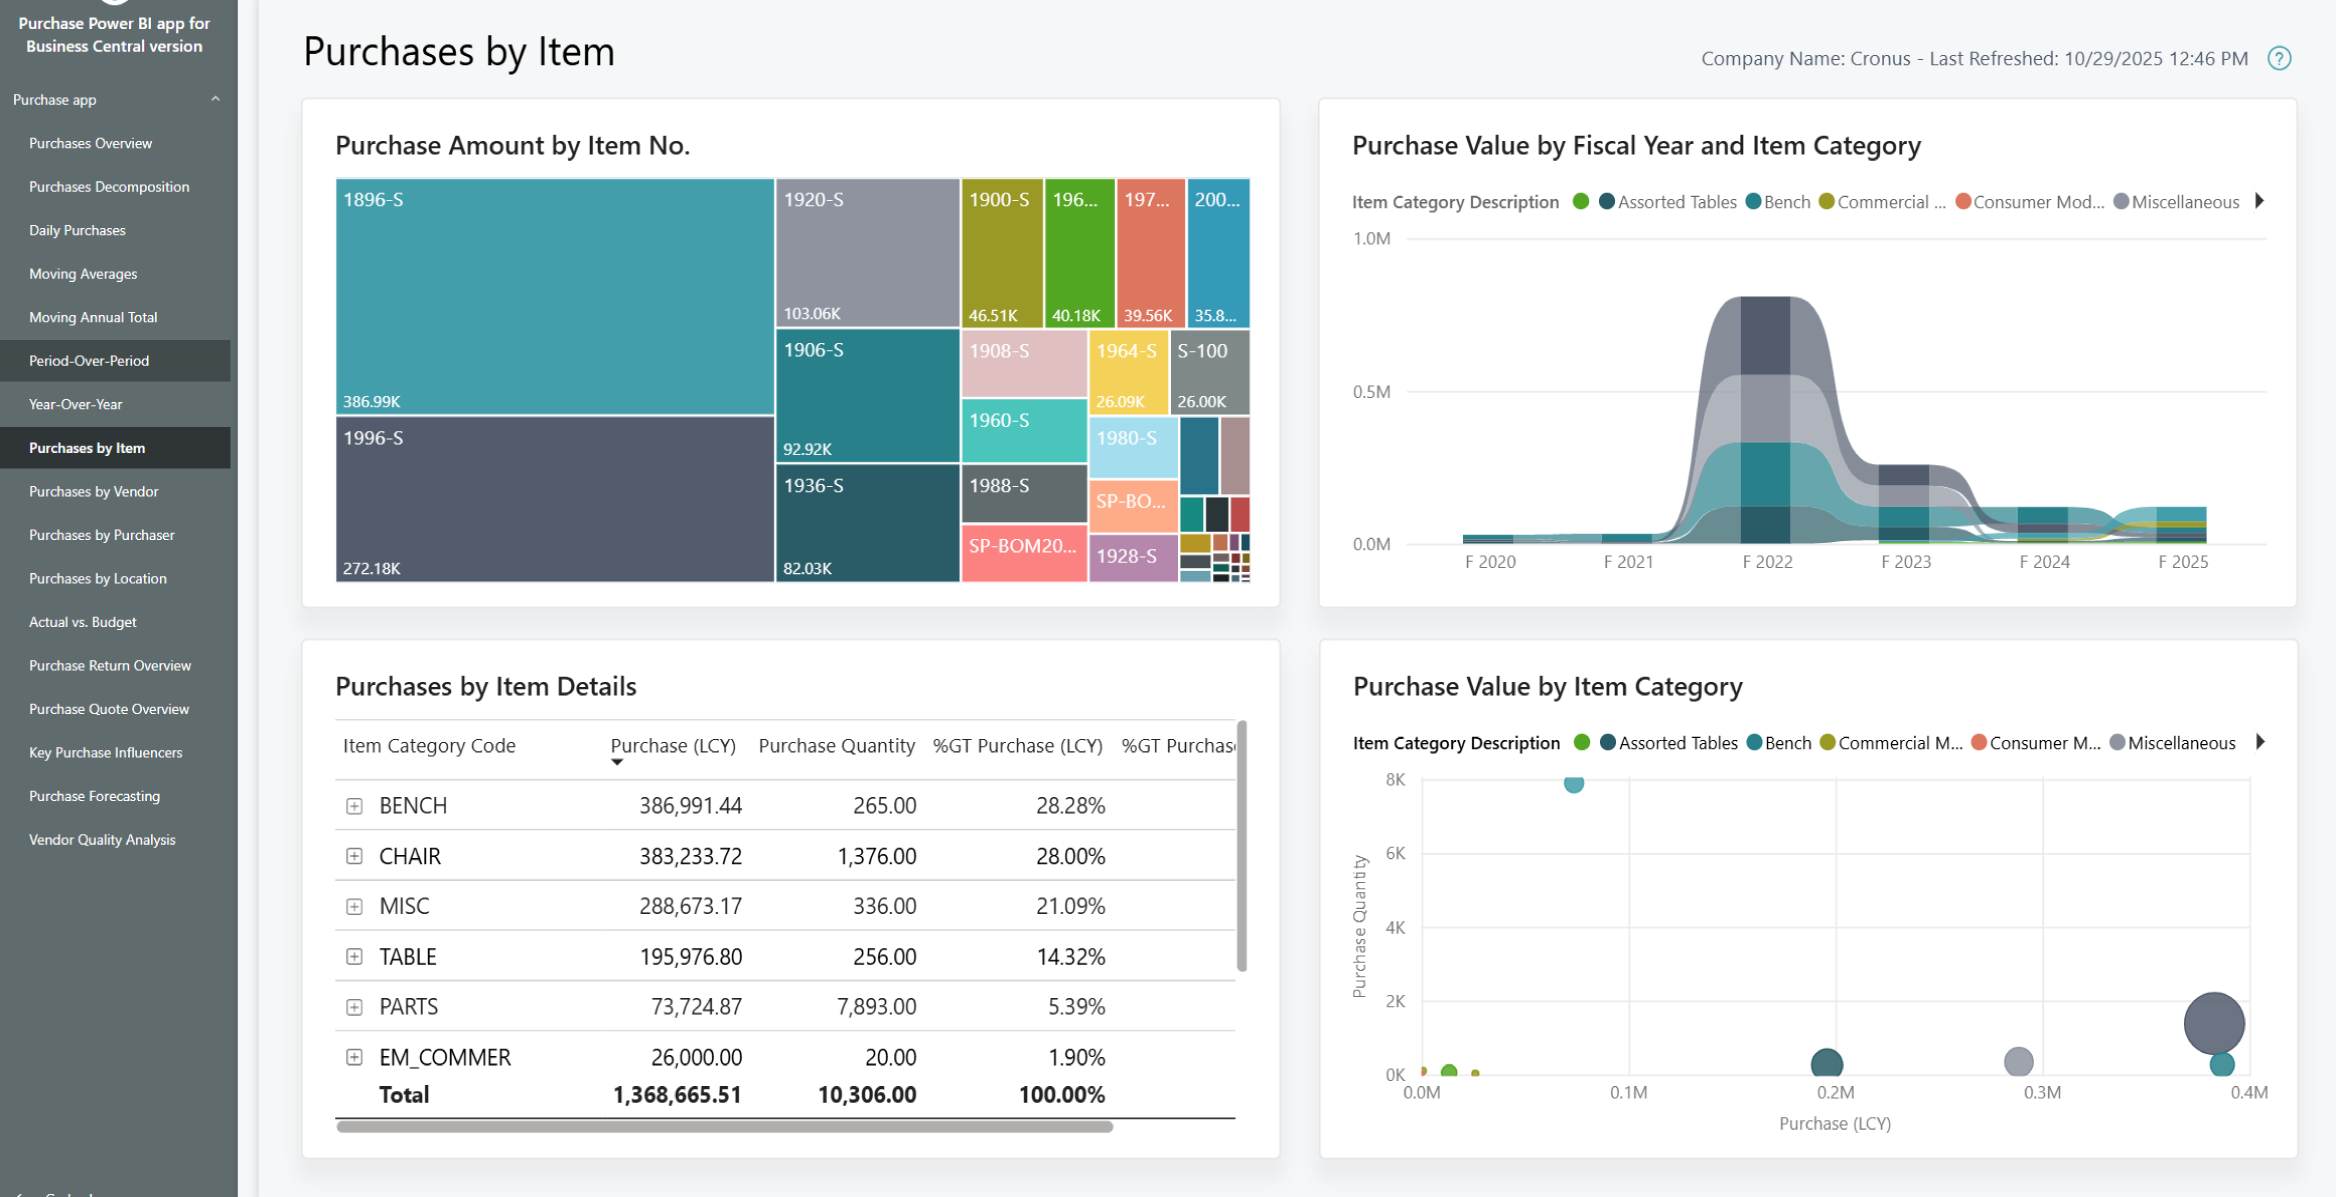
Maintain strong, more beneficial vendor relationships
With tailored dashboards and visualisations, you can see exactly how much you’re spending with each vendor, which vendors supply the most popular items, who’s delivering on time in full (OTIF) and more – all to help you find opportunities to consolidate vendors or negotiate better terms.
Centralise your data architecture for enhanced visibility
By linking Power BI to your Business Central, Dynamics 365 CRM and other data sources, you can bring together data from production, finance, inventory, supply chain and sales to eliminate data silos and provide business-wide visibility. It’ll also be easier to define reporting standards, meaning stronger data governance.
Scale up your infrastructure in line with business needs
Just like Dynamics 365 solutions, Power BI can scale up (or down!) with manufacturing and distribution operations, locally, nationally or internationally. Introduce tailored dashboards across multiple plants, regions or business units to give people access to the data they need, all while keeping things consistent.
Use data and insights to make timely business decisions
Don’t go thinking Power BI is for everyone except you. IT departments can use dashboards to support sound business decision-making, while telemetry can track solution performance, errors and even help tackle potential problems with failure predictions.


Seal more deals by turning pipeline data into actionable insights
Scratching your head over pipeline reporting? Connect Power BI with Dynamics 365 CRM to get better visibility into pipeline health and conversion rates. Visual dashboards can even help you monitor deal progression, keep on top of territory management and remove bottlenecks, helping you seal more deals faster than ever before.
Track ROI to enhance campaign performance and drive leads
With Power BI’s campaign ROI tracker capabilities, you can dig deep into cross-channel campaign performance. Use your findings to refine upcoming campaigns, justify future spend and adjust campaign strategies to push higher-quality leads into your pipeline.
Get a 360-degree view of your customers
Because Power BI pulls data from multiple CRM touchpoints (emails, purchases, support interactions, etc.), you’ll get a reliable, single view of your customers. Use handy reports and visualisations to identify high-value accounts, spot customer behaviour trends and personalise outreach, strengthening relationships – and giving your revenue a healthy boost.
Power BI data integration with Business Central and Dynamics 365 CRM software
Power BI connectors make it refreshingly easy to bring your Business Central and CRM data to life. They pull information straight from Business Central and Dynamics 365 CRM software (Sales, Customer Insights and Journeys) without tricky setups or manual exports. We won’t get too technical, but Power BI data integration happens via Dataverse or OData APIs. This allows you to schedule data refreshes, so you’ll always be working with the latest numbers.
Custom reports are great for those who like to get a bit more hands-on. Whether you’re building from the ground up or using AI to give you a starting point, design reports that show you what you need. You can then publish the reports to the Power BI service to share with colleagues or embed in Business Central or Dynamics 365 CRM, just like you would with a pre-built report.
Pre-built Power BI dashboards and reports can be embedded directly into Business Central or your CRM tools, so you can check for information on sales performance, customer interactions, overdue invoices and more, without ever leaving your ERP or CRM software – whichever you’re working in.
Drill-through links straight into Business Central are driving even quicker analysis, too. Spotted a spike or downturn? Click through and jump directly to the relevant Business Central document to see what’s happening behind the scenes.
Power BI and Business Central FAQs
Power BI presents snapshots of Business Central data (rather than real-time). How often data is refreshed in a day depends on the type of licence you have. If you’re on a Pro licence, it’s up to eight times a day. If it’s a Premium licence, it’s up to 48 times a day. (See more on licensing below.)

You might be interested in...
Video
Guide to installing the Business Central v25 Power BI Reports
How to install the new Power BI reports that are available in Microsoft Dynamics 365 Business Central version 25 and how to connect them to your own data.

Blog
Harnessing the Power of New Power BI Capabilities in Microsoft Dynamics 365 Business Central v25
Dynamics 365 Business Central v25 has rolled out a bunch of new Power BI features that really step up the game for data analysis and reporting. These new tools give businesses great ways to dig deeper into their data and make smarter decisions. Let's take a look at the main perks of these new Power BI features or alternatively watch this video to learn about setting it up for yourself!
Want to know more about Power BI integration with Business Central?
If you didn’t find the answers to your questions here, our team will be more than happy to have a chat.