


Analysis Views in Microsoft Dynamics 365 Business Central have already helped users create pivot-style reports from any list. But many ledger entries have code fields with no description – and this can be confusing, especially if you’re not familiar with the data.
Now, you can pull in descriptions and other fields from related tables to make your reports clearer and more useful. It’s a simple way to build richer datasets and share insights with others.
The best part? These reports are live, simple to use and make it quick and easy to share insights with others. Whether you’re an experienced user or just starting out with Business Central, this reporting tool is designed to help you succeed.
Example scenarios where a finance user can create pivot-like tables using the General Ledger Entries where they can quickly slice and dice the data to either compare month-on-month or determine where costs are rising.
A warehouse manager can build a view to analyse stock turnover by item category and location or analyse identify slow moving items and high demand products in one glance.
Take Customer Ledger Entries, for example. You’ve got two easy ways to add columns from related tables:
Option 1: Click the ‘hamburger’ icon next to the column name.

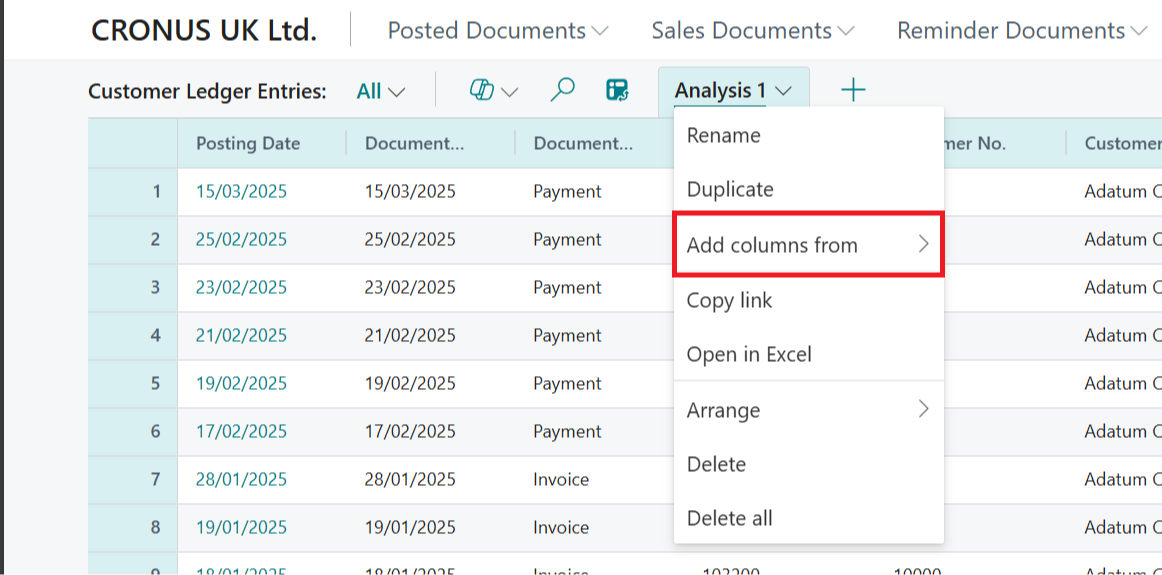
Use the 'Add columns from' option in the Analysis tab dropdown
Option 2: ‘Add columns from’ can also be selected from the drop-down menu on the analysis tab name.
 If the data you need resides in a related table, just select the fields you want from the list.
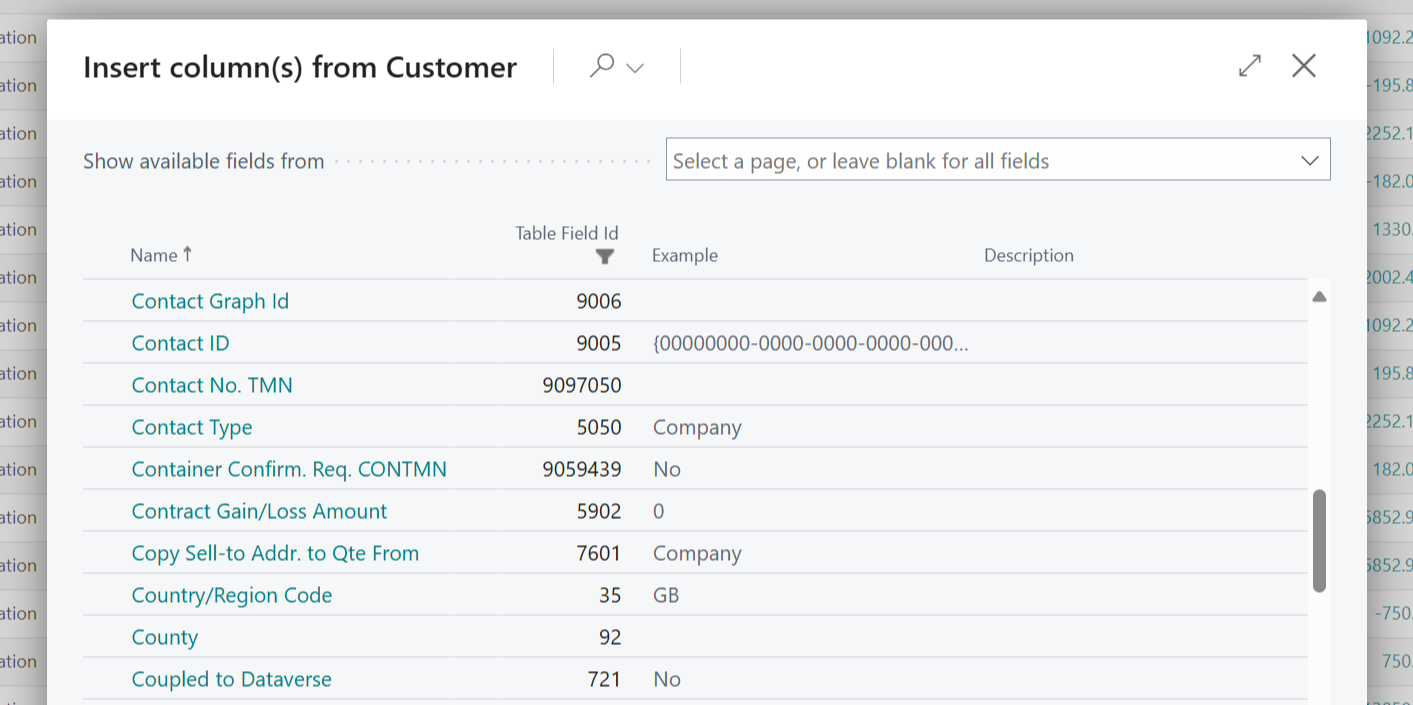
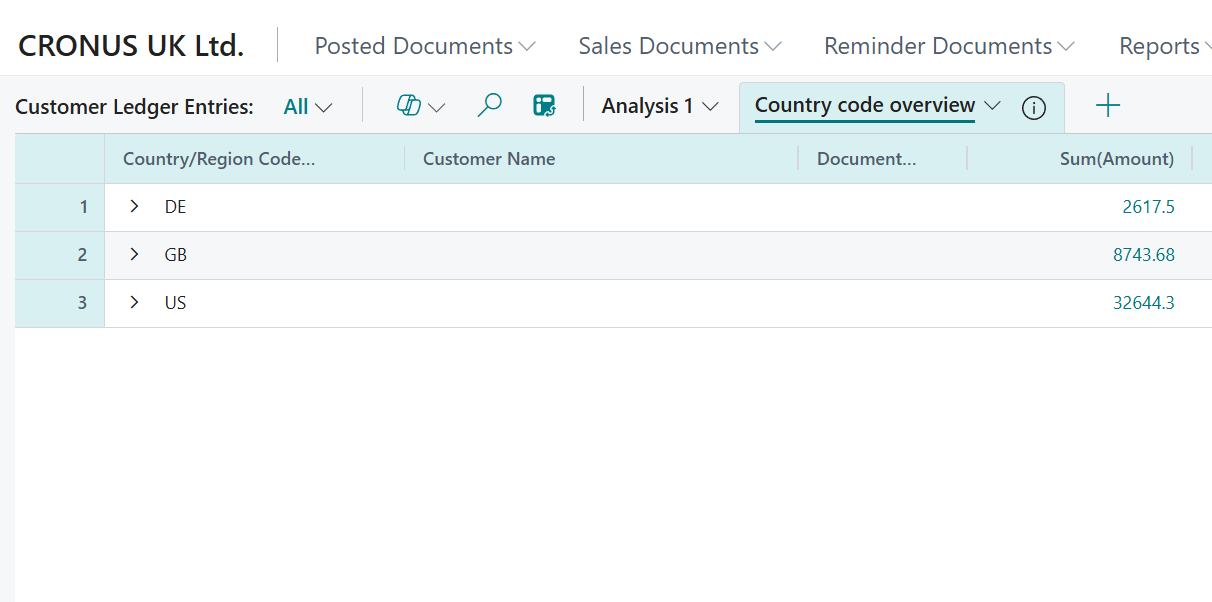
By adding extra fields from the Customer table, you can make your reports more tailored and insightful. Adding the country code allows the data to be grouped and analysed by region or simply add Payment Terms to quickly identify customers that are always late to pay.
You can move the columns around by clicking and dragging to the appropriate position to give you a report structure you’re happy with. You can even resize the columns to show the full data in each field (particularly handy for descriptions, which tend to be on the longer side!).
Wrapping the column headers to display full field names is also an option – or you might want to freeze a particular column when the report has multiple fields to scroll to view data, so you can always keep it visible. Don’t forget the filters, too, where you can choose to only show the data required for your analysis.
Need more data? Use the 'Other Source' option to link additional tables.
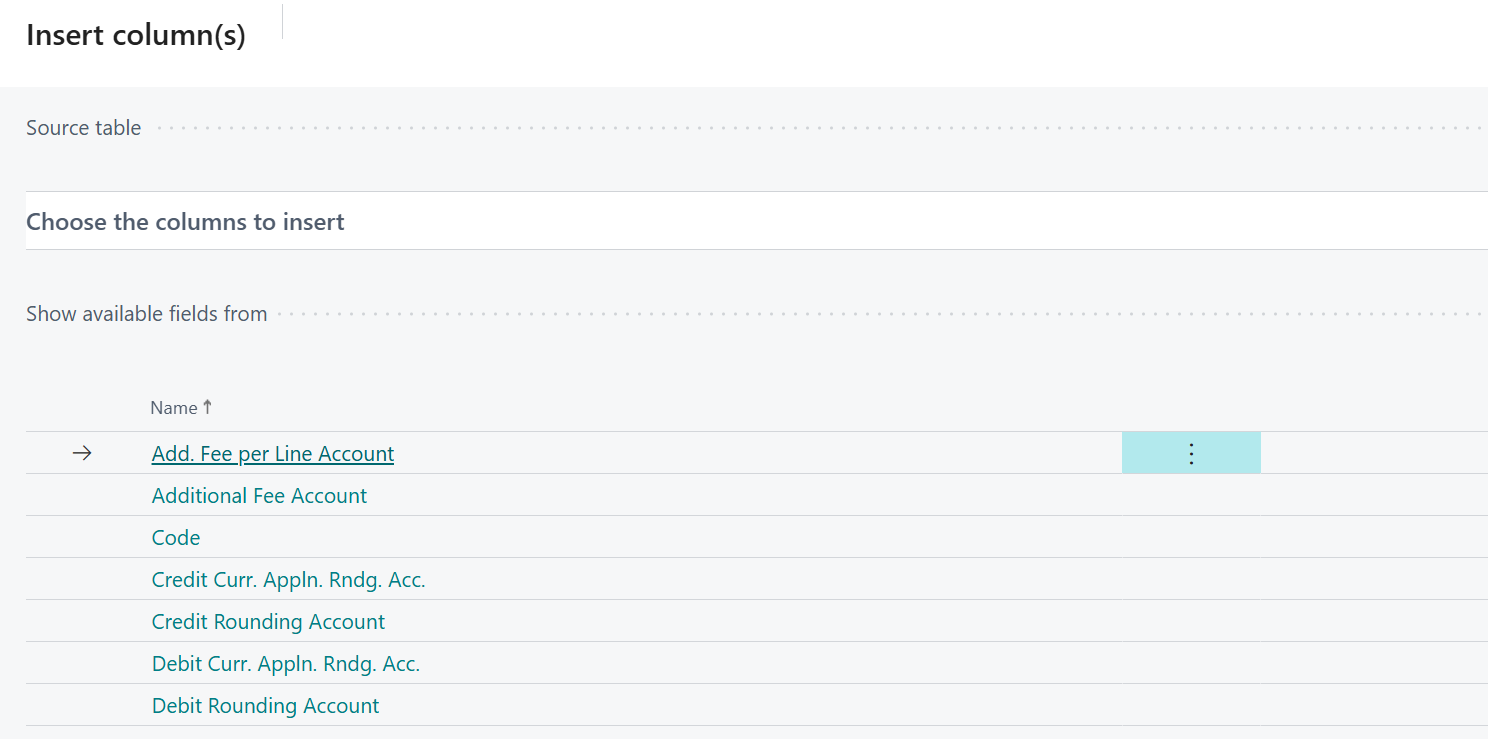
Once you define the source table, the system automatically creates the link, allowing you to choose columns to include in your analysis.
Note: When using 'Other Source', make sure there’s a field available to link to the related table. For example, the Customer Posting Group field in Customer Ledger Entries enables this connection in the example above.
Any fields you add – whether from linked tables or other sources – behave just like native fields, so they’re easy to group, sum and analyse.
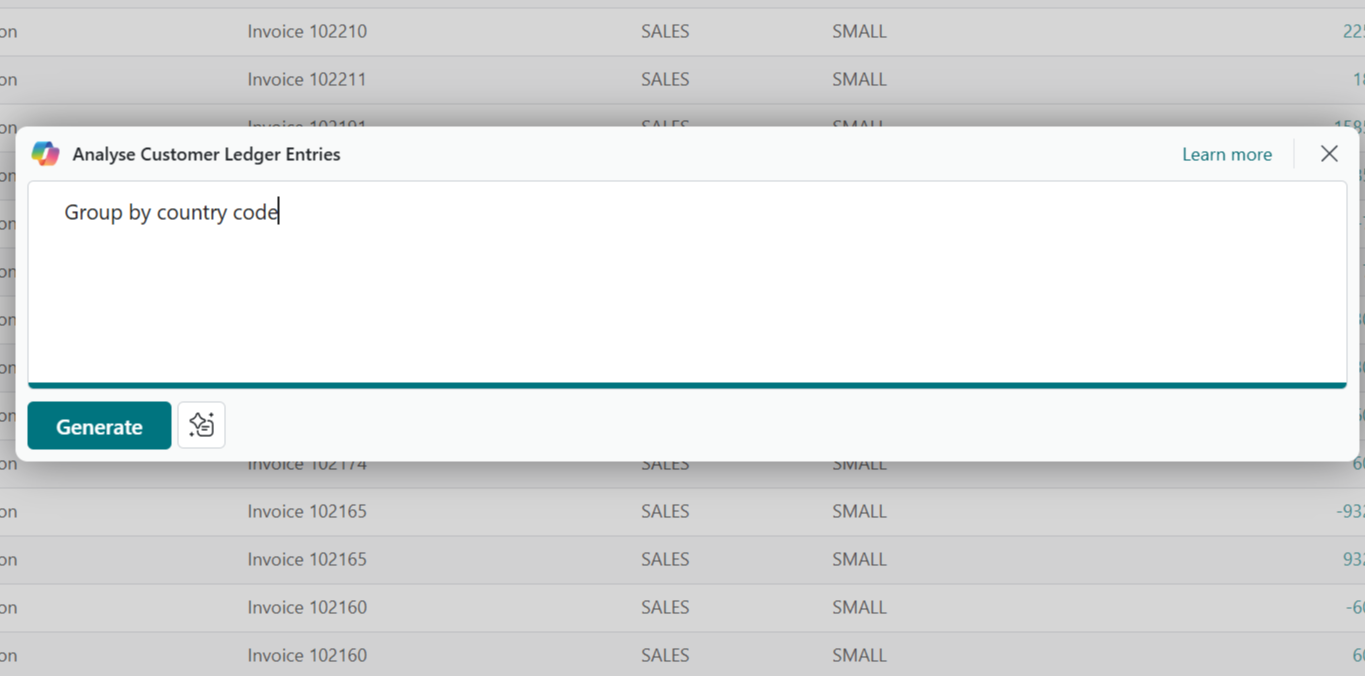
And yes, Microsoft Copilot can help, too. If you ask it to include something like Country Code (which isn’t on Customer Ledger Entries but is on the Customer table), it’ll add it for you automatically.
This update puts users in the driver’s seat, helping them take control of their data and make smarter decisions, faster.
For Business Central training, or a conversation about moving your Business Central support to Tecman, drop us your details today.