


Why bother exporting data out from Business Central, just to create a pivot table within Excel? Or even simply just to work out totals? Business Central now has a tool called Analysis Mode that you can turn on that will allow you to do the bulk of the work you would have previously done within Excel, inside the system itself. We think it’s rather fabulous and you can save these as data layouts to reload at any point.
This is a new feature, currently, it needs to be turned on first through Feature Management. But with the next release of Microsoft Dynamics 365 Business Central, it will be turned on automatically for everyone.
Any list page with Analyse added to it can use this, and that is most list pages. Simply tick the Analyse slider to begin.
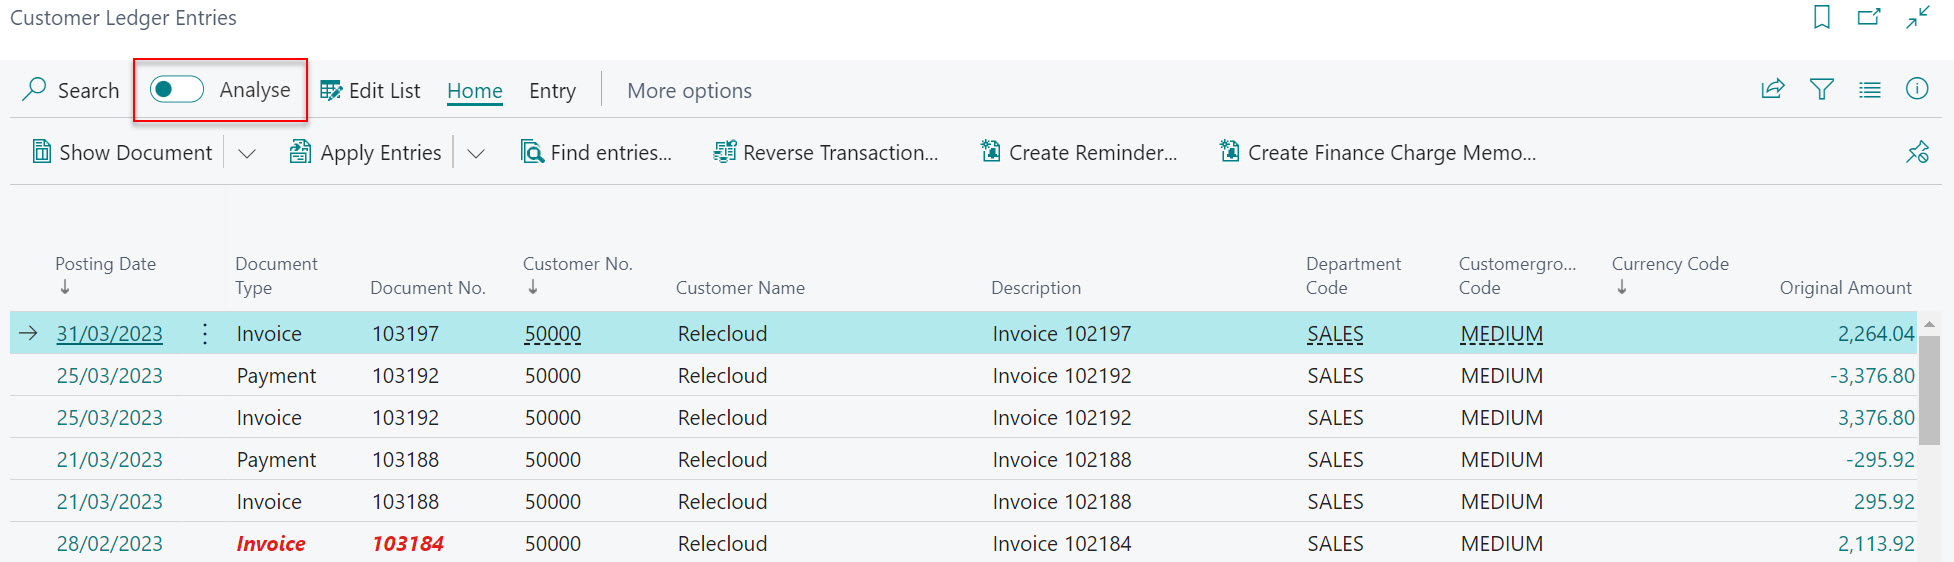
We’ll do our examples on the Customer Ledger Entries page, as this data has a lot of use cases with this feature and many finance teams may export this information out to Excel.
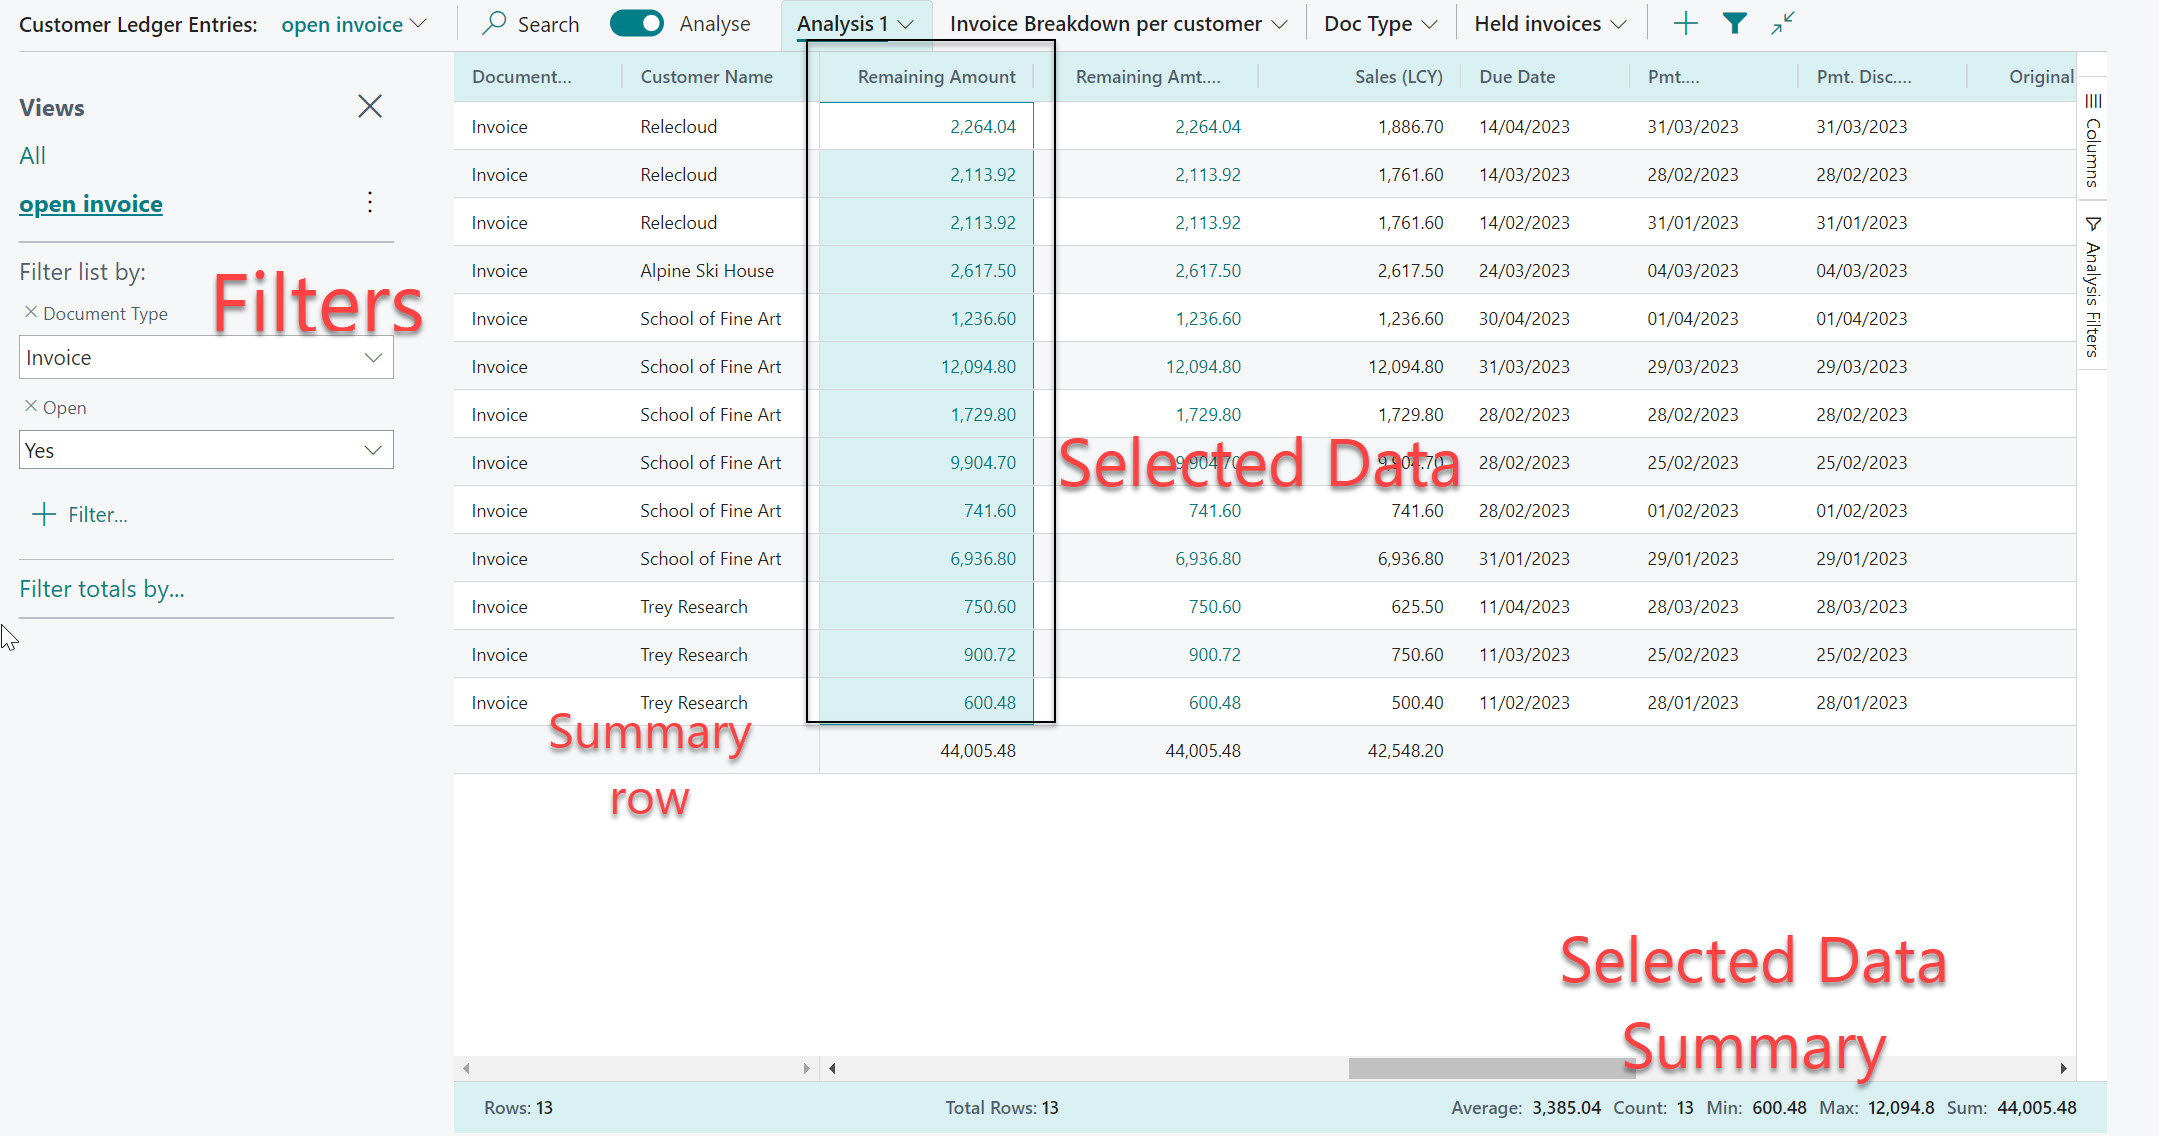
Initially, data will look the same, layout wise, but it will now include a summary row and a selected summary when you’ve highlighted a selection via clicking and dragging. As usual, data can be filtered via the filter pane to get only the data you need, though data can be filtered in other ways.
Data can be easily grouped and filtered as well as the display altered.
Here, from the Columns tab on the right we can:
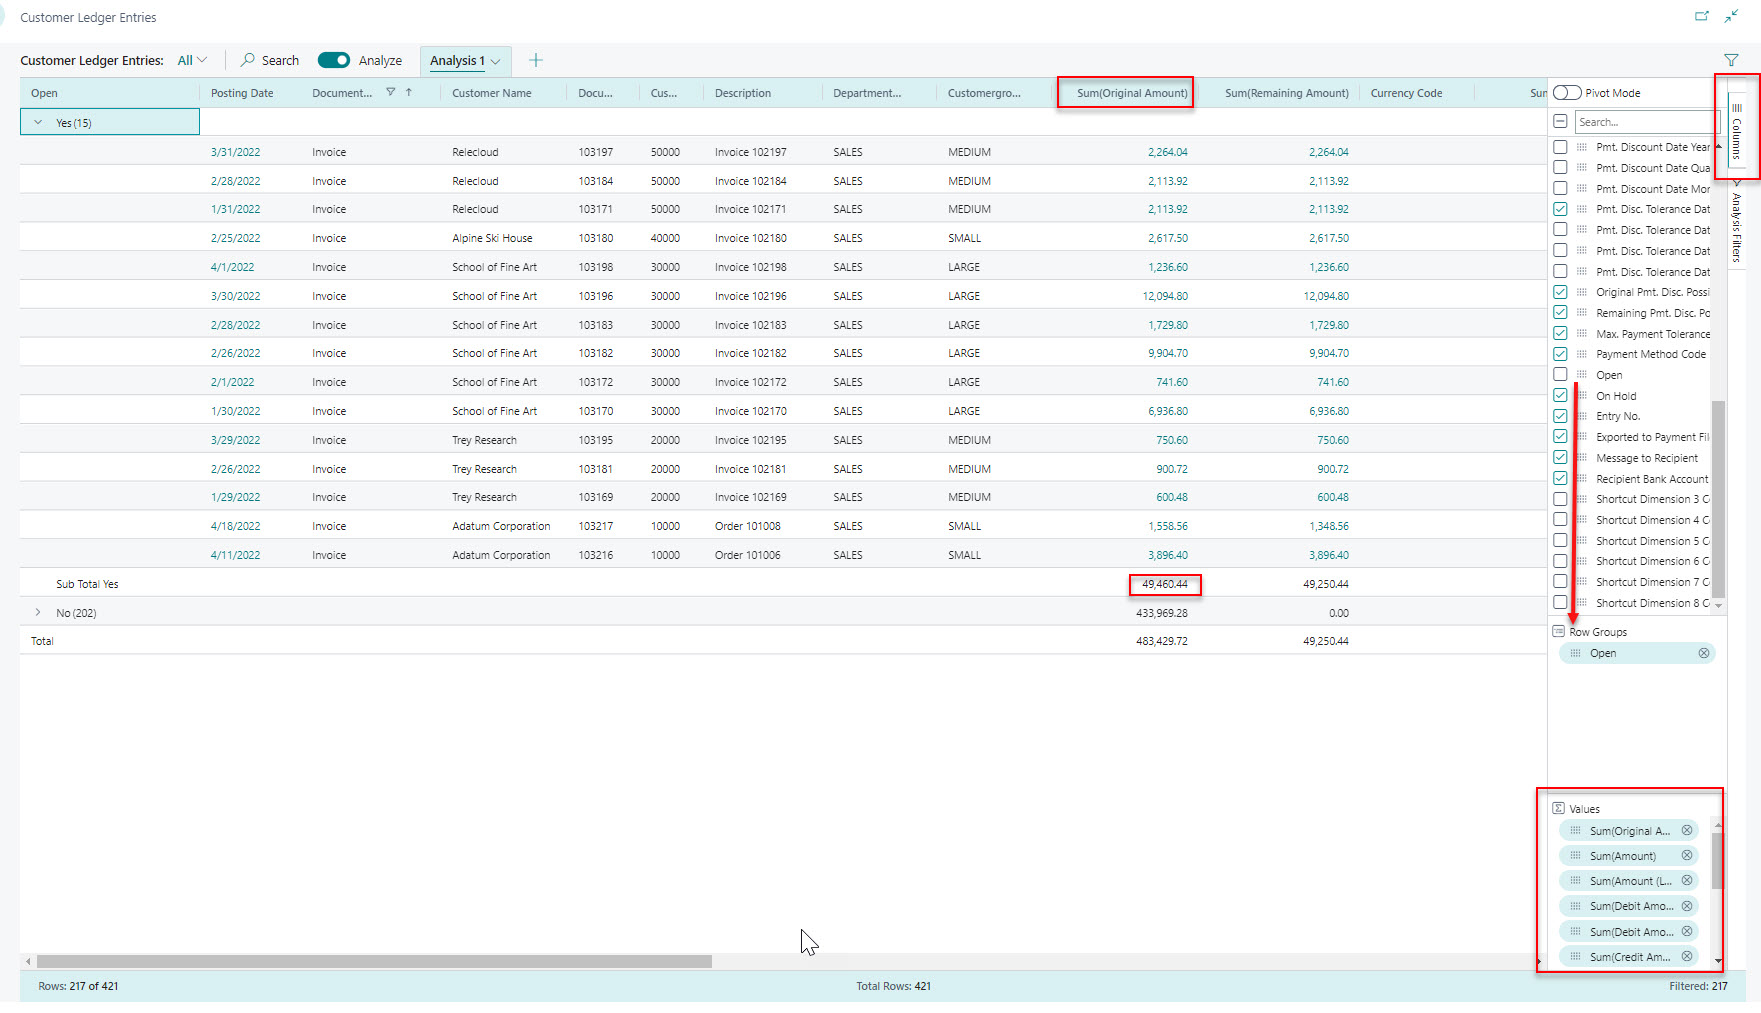
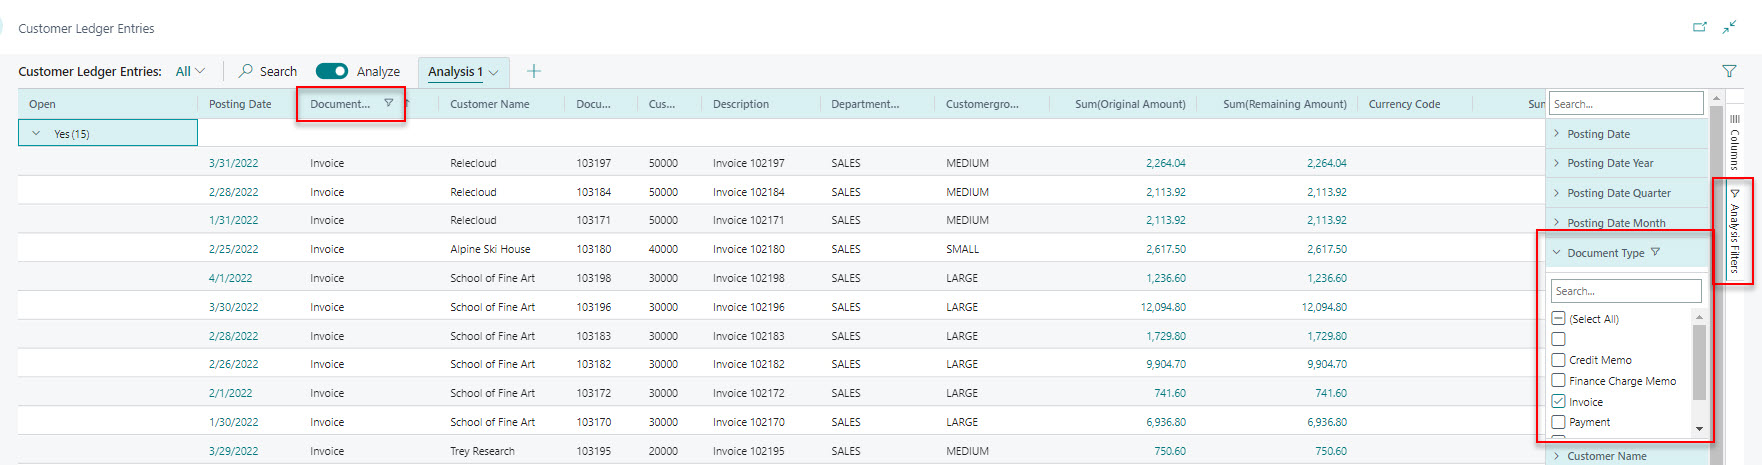
So above you can see we’ve grouped by Open and Closed entries (Yes and No on the Open field) and we can see the outstanding amount on the open invoices with ease. To ensure this is just the Invoices, we can click the Analysis Filters option on the right and just configure what data we are filtering to on this view. In this case, Document Type to Invoice:
If your main reason for exporting data to excel is to put data into pivot tables, you can do the same here. From the Columns tab on the right, just tick Pivot Mode.
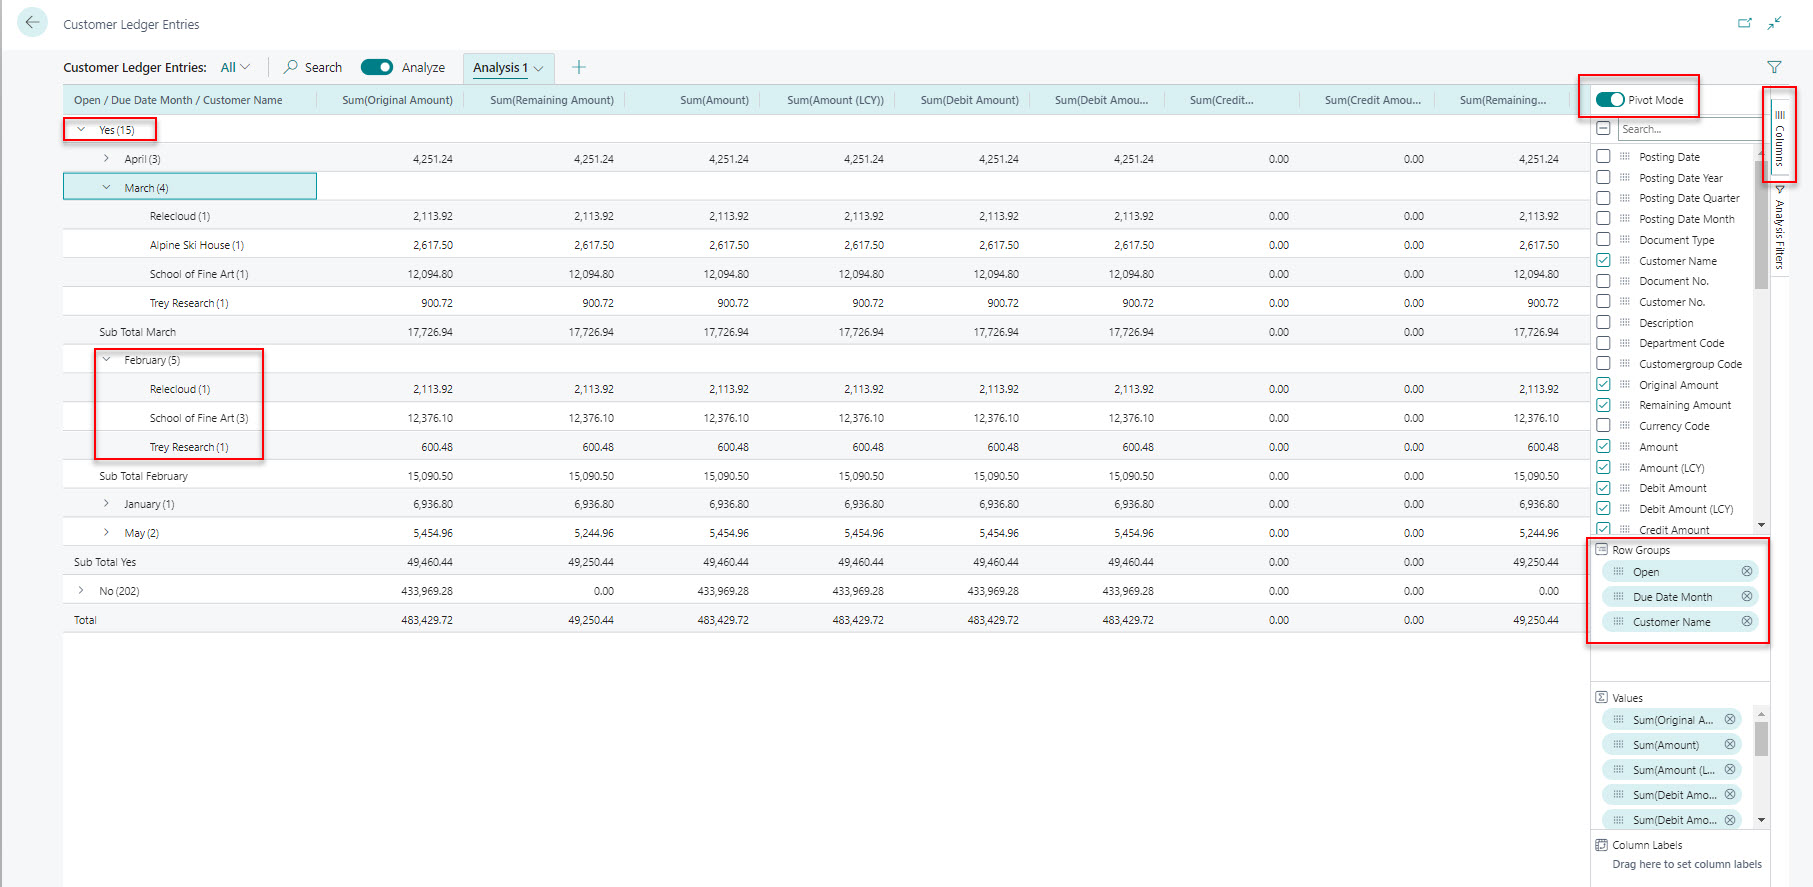
Simply ‘drag and drop’ the columns for Open, Due Date Month, and Customer Name to create our report. This gives us breakdowns of Open / Closed invoices per month along with totals.
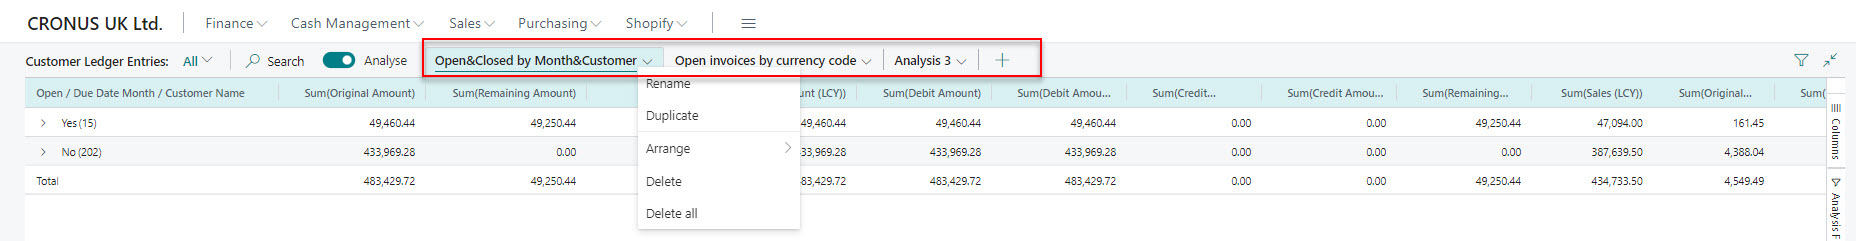
Business Central will also remember what Columns/Filters/Grouping etc. you last had next time you turn on analyse. In fact, you can create multiple analysis tabs as you see fit. Clicking the + Plus along the top creates a new tab with the default layout. Each tab remembers how it was left off, meaning you can create a number of tabs/views for different reporting purposes you can load at any point. Each tab can be named to make it clear which is which.
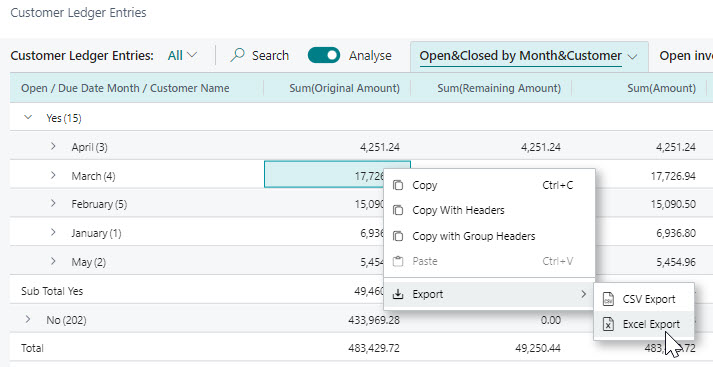
By the way, you can right click anywhere to export the data on screen to Excel.
Things to note:
We haven’t covered all the features with Analysis Mode, just given you a taste.
For a more in-depth look, check out this video.