


Public Preview – July 2021, General Availability - not yet known. *
Dynamics 365 for Sales has always been a powerful Sales tool, and over the years has seen some really good features introduced to make the ability to capture the data around the sales process easier and to be able to use this data to report on it.
Creating these dashboards, whilst possible for normal users, was not always in reality that easy for them to do though, and it often fell to the system customisers to try and understand what it was the Sales Teams needed to see.
With the introduction of Deal Manager, the Sales Team now has a simple, and easily customisable dashboard that they can tailor to their individual needs.
So, what is Deal Manager?
Simply, it’s a pipeline tool. It shows you both graphically and in a list of data, where you are with your opportunities.
Let’s take a look.
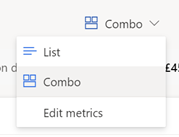
Deal Manager has 2 usage modes.
Combo: This shows the Bubble or Funnel view with a list of the opportunities at the bottom that can be used to navigate to individual records.
Bubble Chart:Â 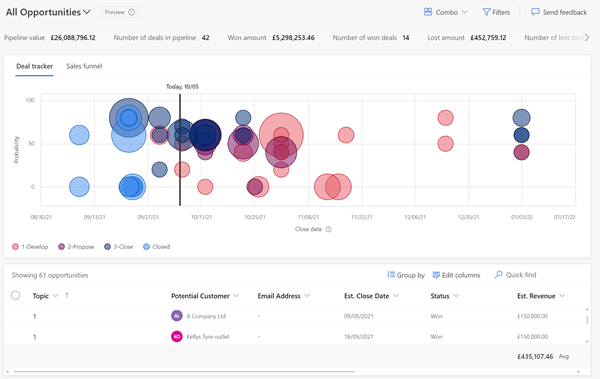
Funnel Chart:Â 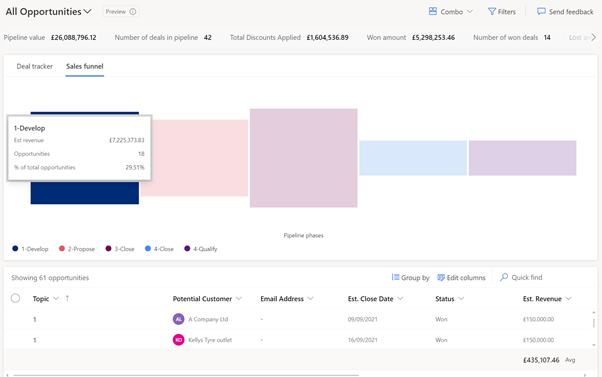
Pretty, right?
But let’s have a look under the hood because anyone that has ever created dashboards before will know, pretty is great for a few days, then users start wondering about the function and the underlying data.
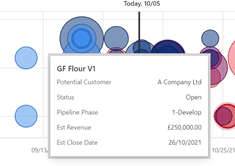
Hovering over the ‘Bubbles’ will give you a flyout window with some basic information about the Opportunity you are looking at.
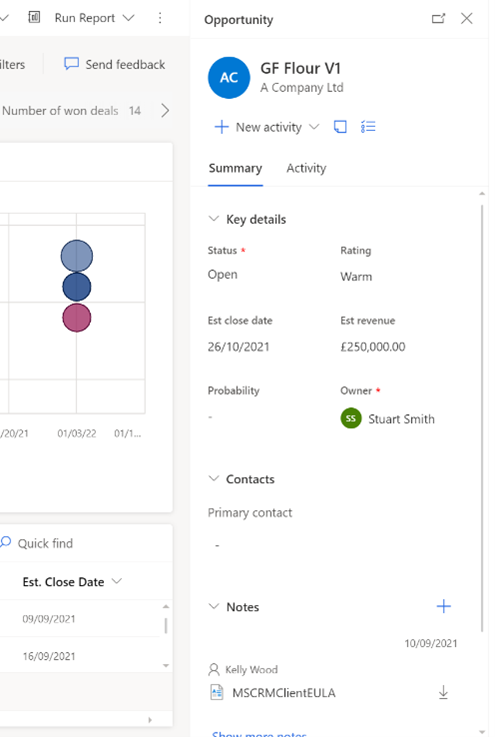
If you click on the ‘Bubble’ you now get a nice reading pane open on the right-hand side, where you can view or even update some basic information about your Opportunity. Add activities and notes about your interactions. All from within the context of Deal Manager.
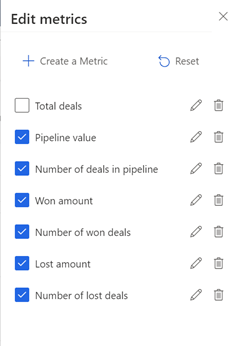
You may have noticed too, in the original picture, there were some figures across the top of the chart, showing us some information about our Pipeline as well as our Won and Lost Opportunities.
Let’s take a closer look at the metrics.

Pretty standard. A count of our Opportunities by their status, a sum of the revenues in our Opportunities by the amounts.
Nothing too exciting here really, right?
Well, actually there is.
Remember, Deal Manager is all about empowering the Salesperson, and what better way to do that than to allow them to create their own metrics and without a roll up field in sight!
If we click on the view button, we get the ability to edit the metrics that are shown.
There is some standard, run of the mill ones. Everything you would expect from a Sales Dashboard.
But the really exciting part is the ability for your Sales Team, on the fly, to create their own. Say they are having a Sales Team meeting, and someone says “Ooh, I wonder how many opportunities we have had to discount this monthâ€. Let’s have a look in a live, real-time way.
So, you click on Create Metric, give it a name, and pick a value you want to see.
The list of fields is limited to numbers right now (including currencies), but it is in preview, so maybe we will get more options on GA or in a future update.
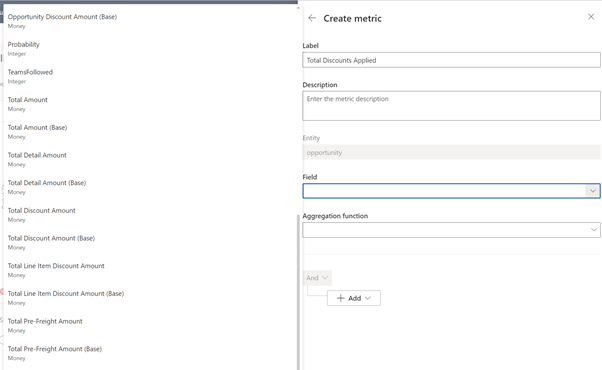
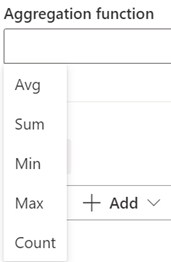
We get the standard aggregation functions you would expect.
And then the ability to filter our data for your Metrics if needed.
The positioning of the Metrics on the dashboard can be changed by simply dragging and dropping the Metrics on the edit metrics screen, so you can see the information where it is best displayed.

And you can apply dashboard wide filters using the filter icon next to the view selector.
Power to the Salespeople!
But hang on, I said there were 2 ways of using this right?
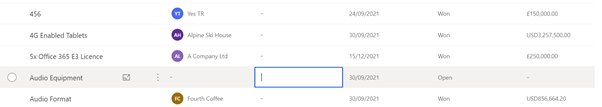
The 2nd is just a list view. But it gives the user the ability to add more columns to the standard system view if they wish to.
This ‘just’ a list view is a (slightly improved) standard editable grid so your team can update their list of Opportunities still right there, in the Deal Manager screen.
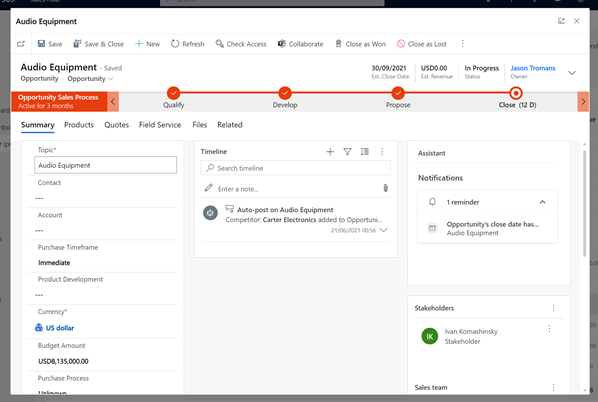
But what if they need to fill in more in-depth information? An editable grid is nice, but navigating to the form is easier for larger data entry, right? Well, they can click on the Pop-Out Button and view their Opportunity on the system form without navigating away from their Deal Manager screen, complete with Business Process Flow.
And once they are done, simply close the Pop Out window and return to where they were.
But what about the external Salespeople? Well, this functionality also works via the Mobile App and the new Sales App that is still in preview (tested on Android). Admittedly, the use of screen real estate on a phone isn’t the best right now, but the Tablet Form Factor displays very similar to that in the browser window, meaning your tablet users don’t have to miss out.
So sure, Deal Manager is really pretty on the surface; but once you scratch that surface, you start to find the intelligence and functionality that can really empower your Sales Teams. Enabling them to track, update and even report on their Pipelines in a way as individual as they are, without the need for personalised dashboards to be created.
Go have a play (in your Sandbox, of course) and enjoy! If you have any questions about Deal Manager, please contact your Account Manager for further assistance.
Â
*Note: This functionality is still in preview and so may not be exactly as described at General Availability; And as with all preview features, should not be enabled in a production environment, no matter how excited you are!
Â
Â