


With Microsoft Dynamics 365 Business Central 26.2’s release, the long-awaited enhancements to the analysis mode in Business Central have been rolled out.
Analysis mode has always allowed you to summarise, group and pivot the data on a page for insightful reports, but now you can pull through data from other tables and pages, as well.
For example, this means that if you’re working on a Ledger Entry page, you can pull through the Customer/Vendor/Item, etc. names rather than just use the codes. (Global) Dimensions can also be easily added to expand the reporting capabilities of many pages.
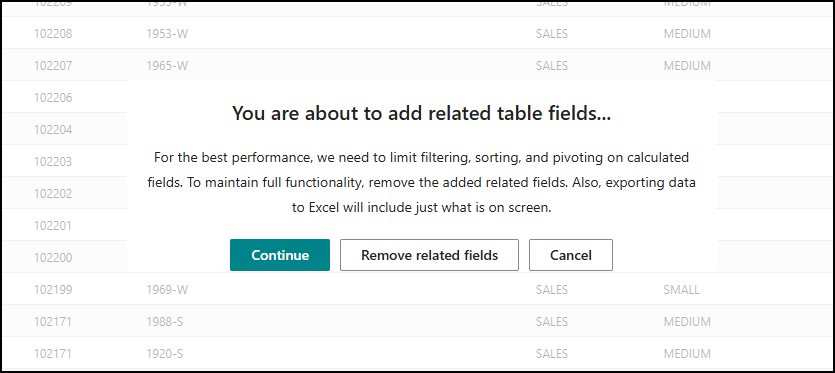
Before we show you how to do this, it’s worth mentioning that when you’re adding fields, this can cause some wait time for it to be ready, particularly on very data intensive pages. Consider pre-filtering your data before opening the analysis mode, or just understand that loading, sorting and customising the page may take some time.
Adding these fields in will also limit filtering, sorting and pivoting on calculated fields (otherwise known as FlowFields).
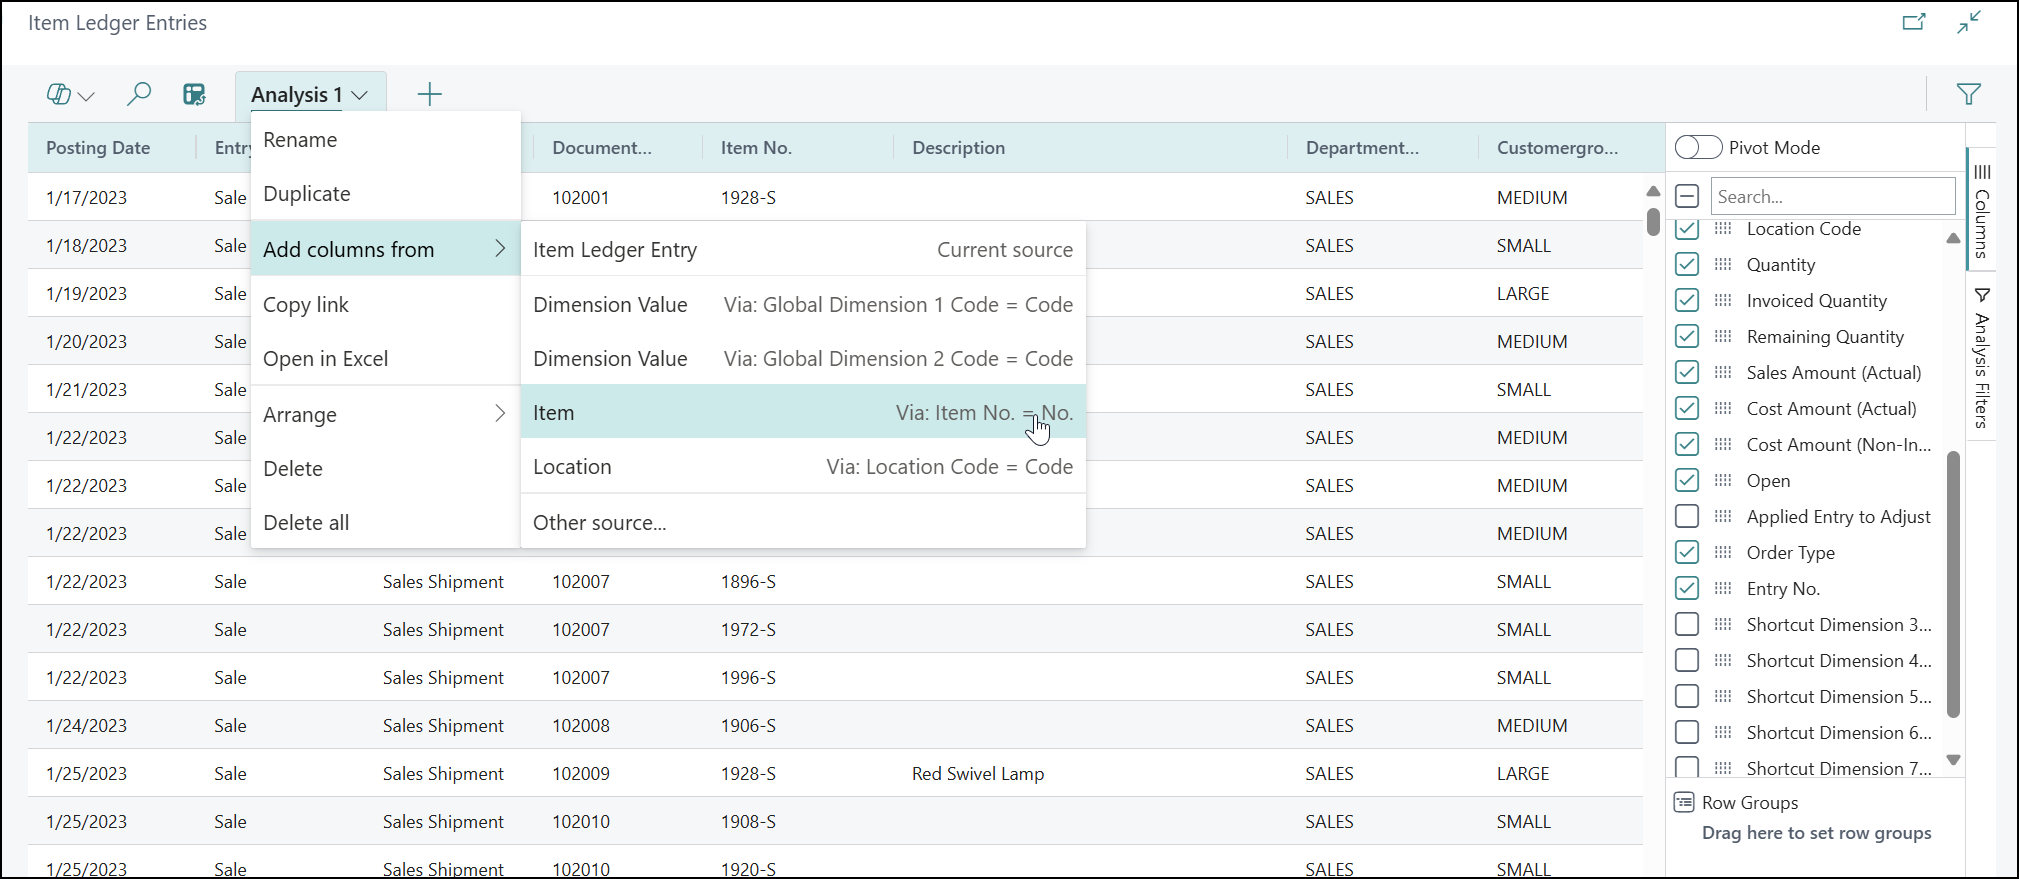
The way this works is simple: when you’re on a page and have activated the analysis mode via the button in the upper left, you can click the heading of the tab you’re working on and select Add column from.
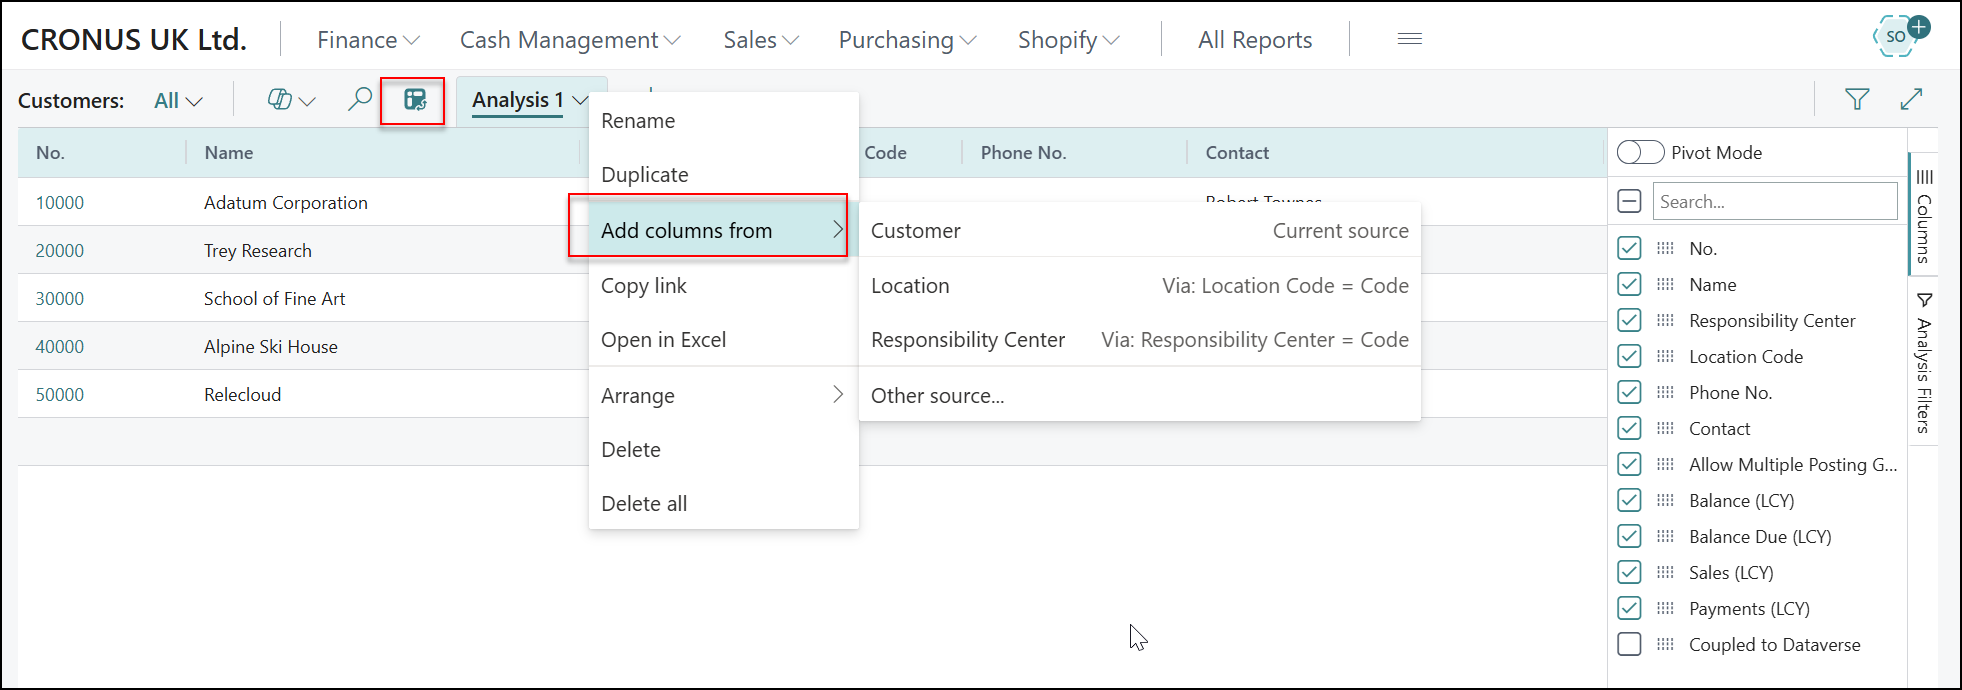
There will be some examples to select from. The top will often be the ‘Current source’, which is the Table in the background of the page you are on. This may initially seem like a shortcut to add in fields you could just add via personalisation, but it actually includes things you ordinarily couldn’t add via personalisation, such as Global Dimensions. 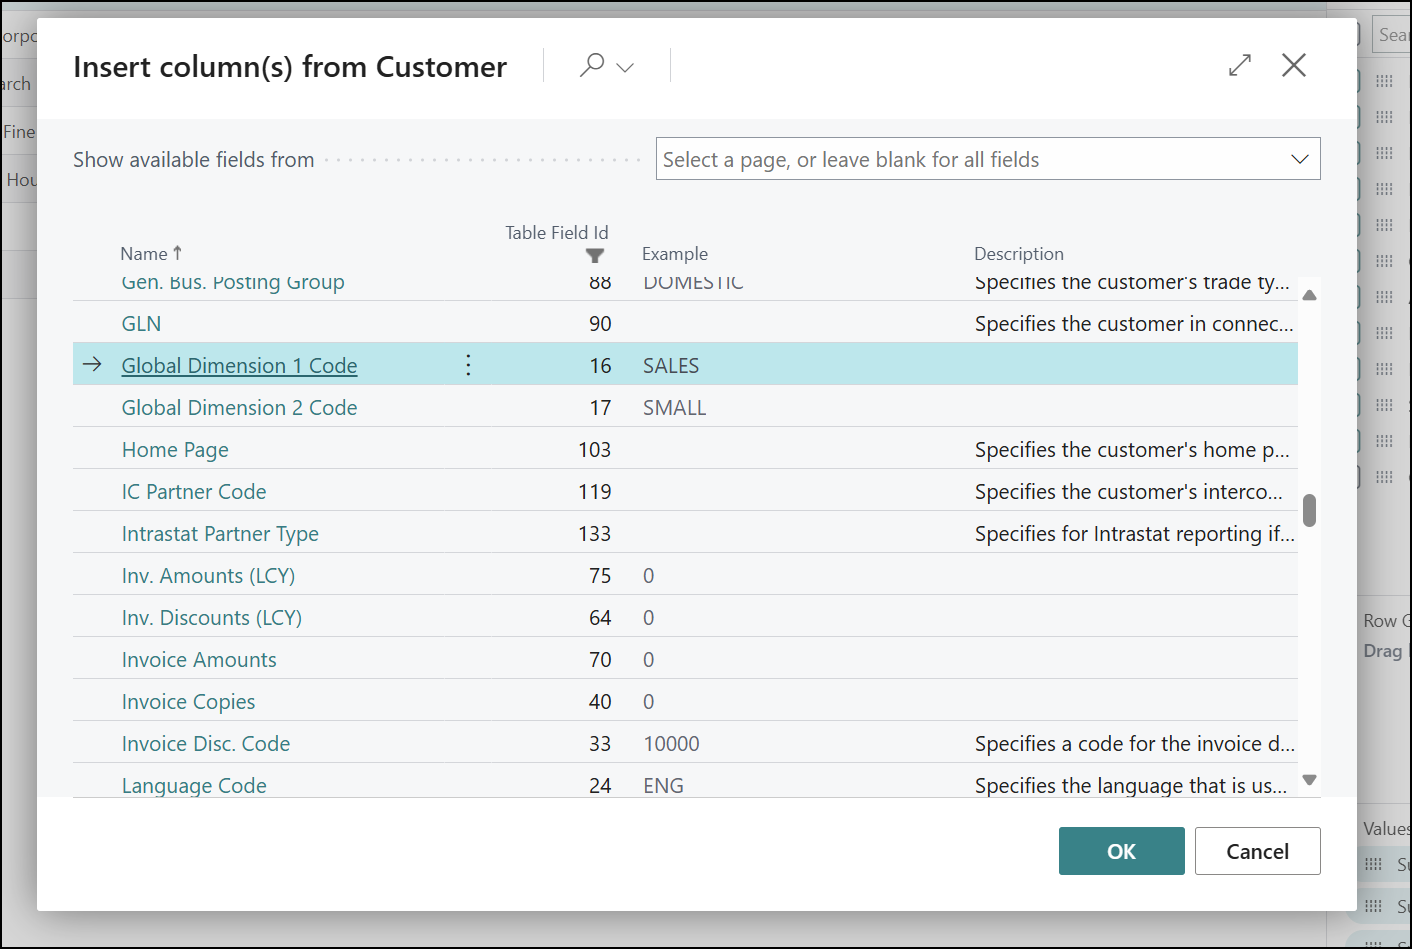
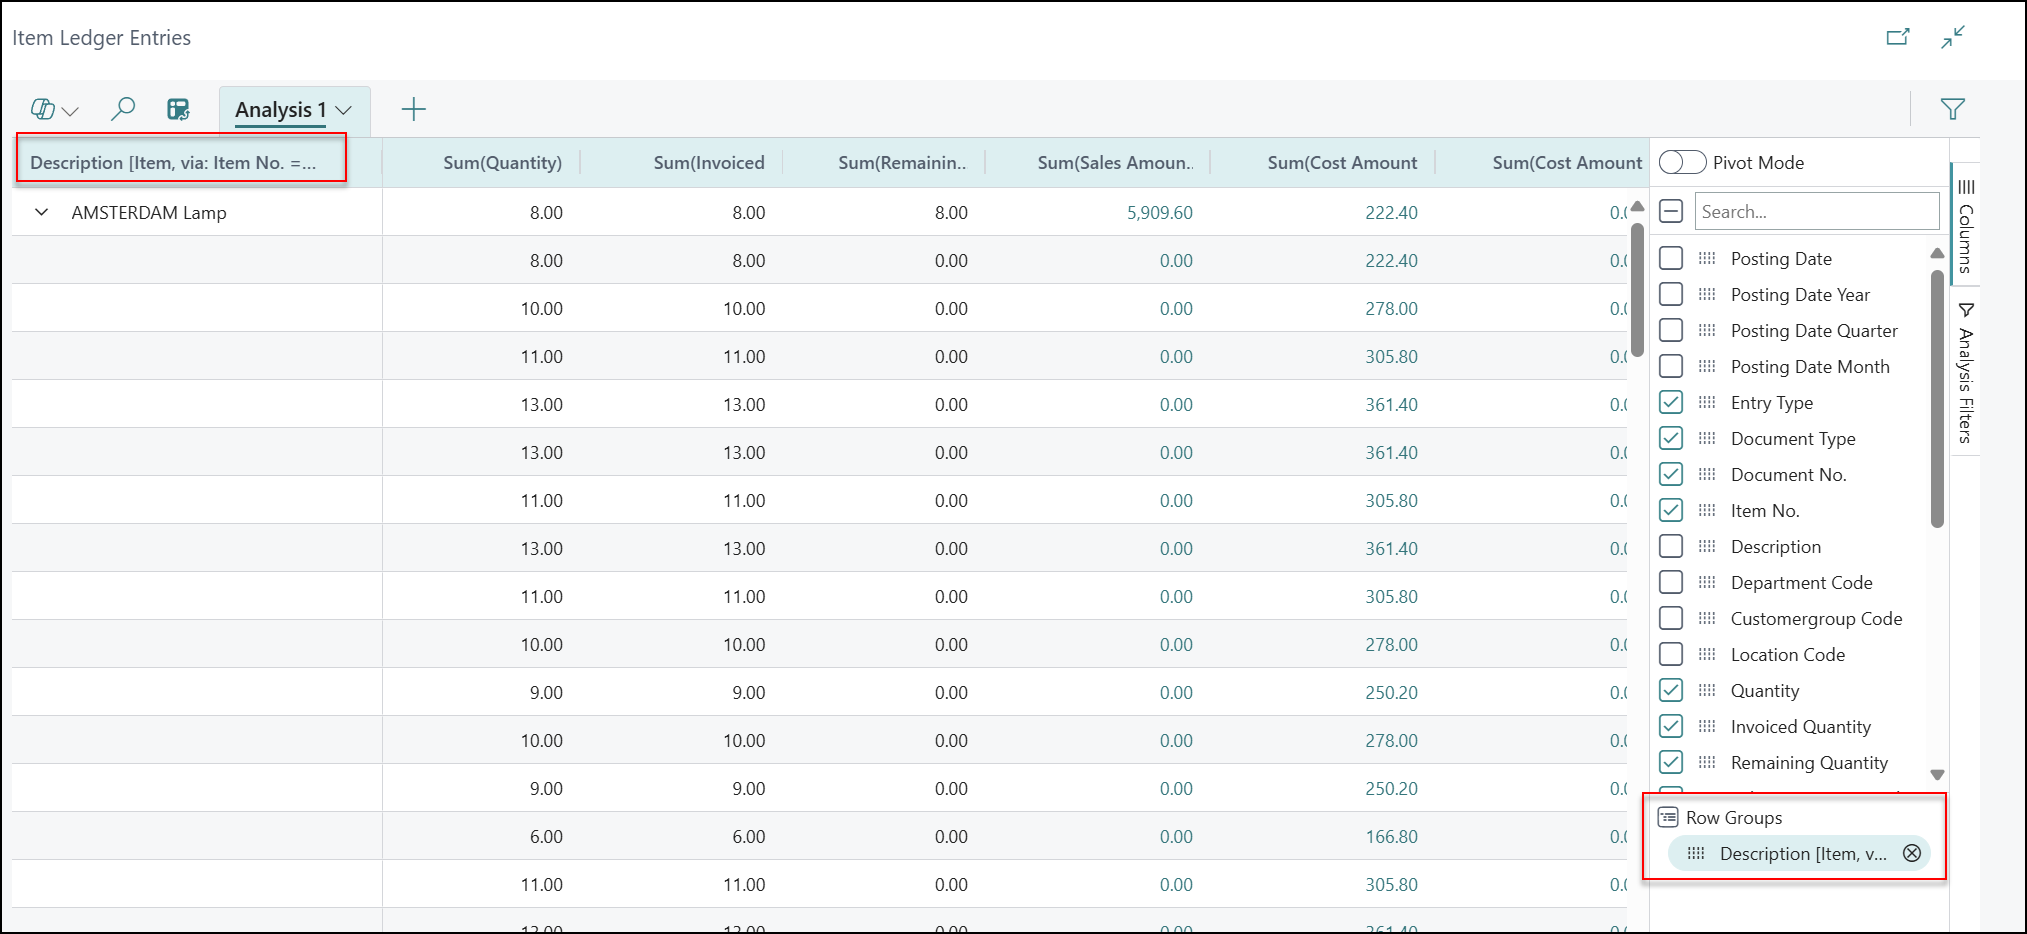
This means that the usual lacking fields can be easily added to pages. For instance, you can use this to add the Description field on the Item Ledger Entries meaning that you now see not just the Item No. but also its actual name, which may be much more helpful.
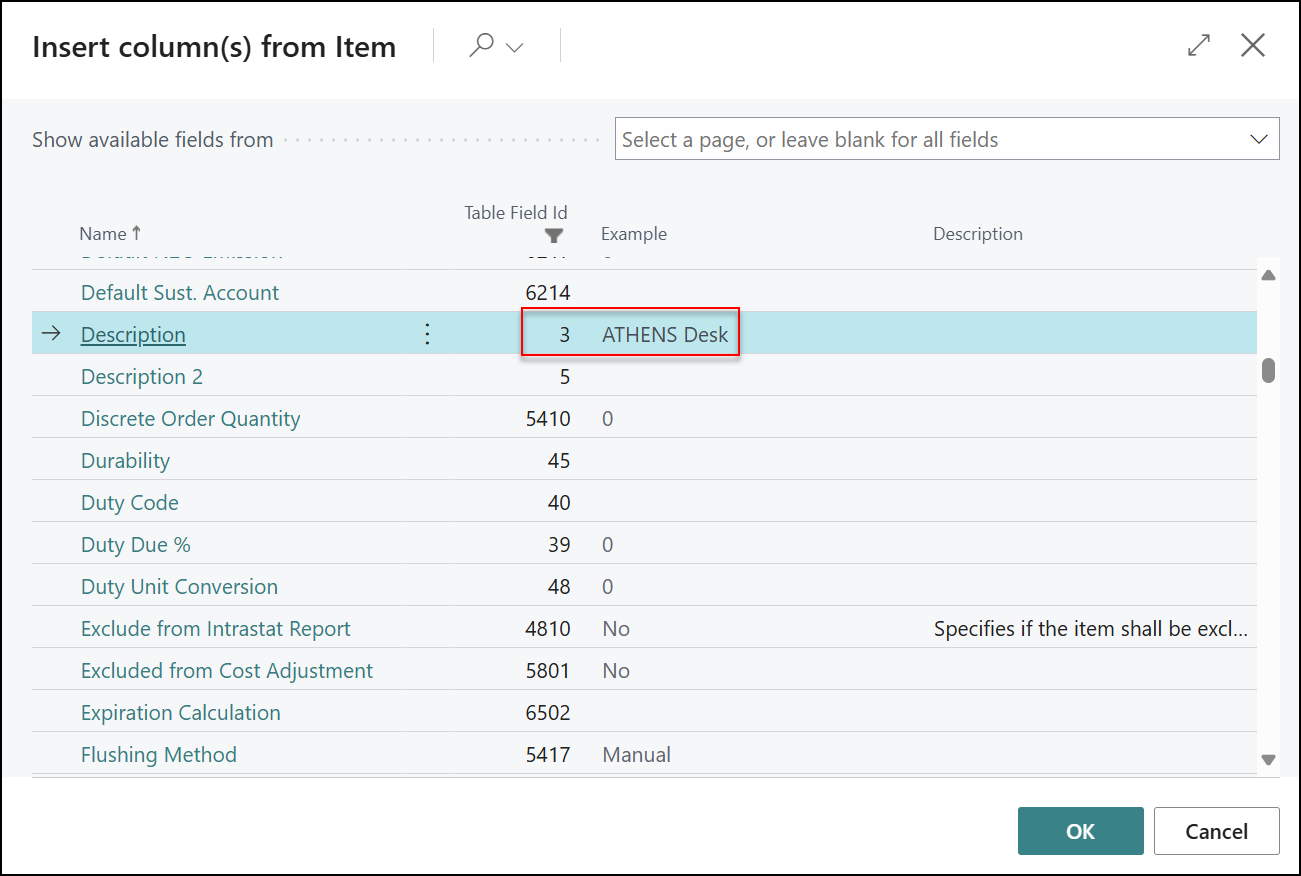
When selecting the column to insert, you will also have an example of the data being added to ensure it’s the right kind of information. Some will even have Descriptions for certain fields.
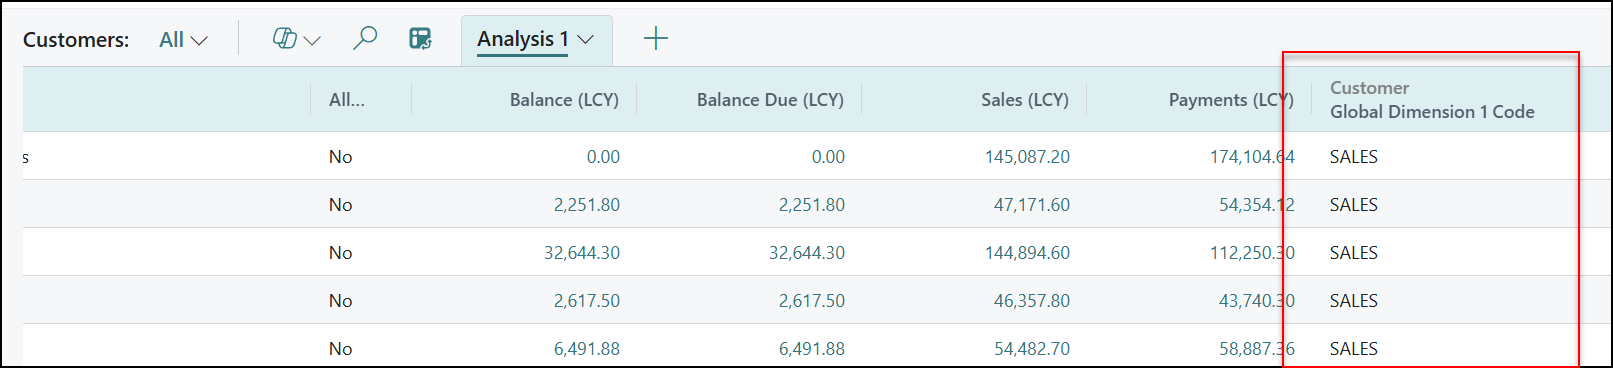
Once added, the additional field can be used as a grouping for the analysis mode for easy summaries without a need for cross referencing:
Let’s see some examples of what we can do with this.
Here we’ve filtered the Sales Lines page to just show Order Lines with an outstanding amount to ship. We’ve added in from the Customer table the Post Code & Address 1&2 to group and see the outstanding shipment information from one page.
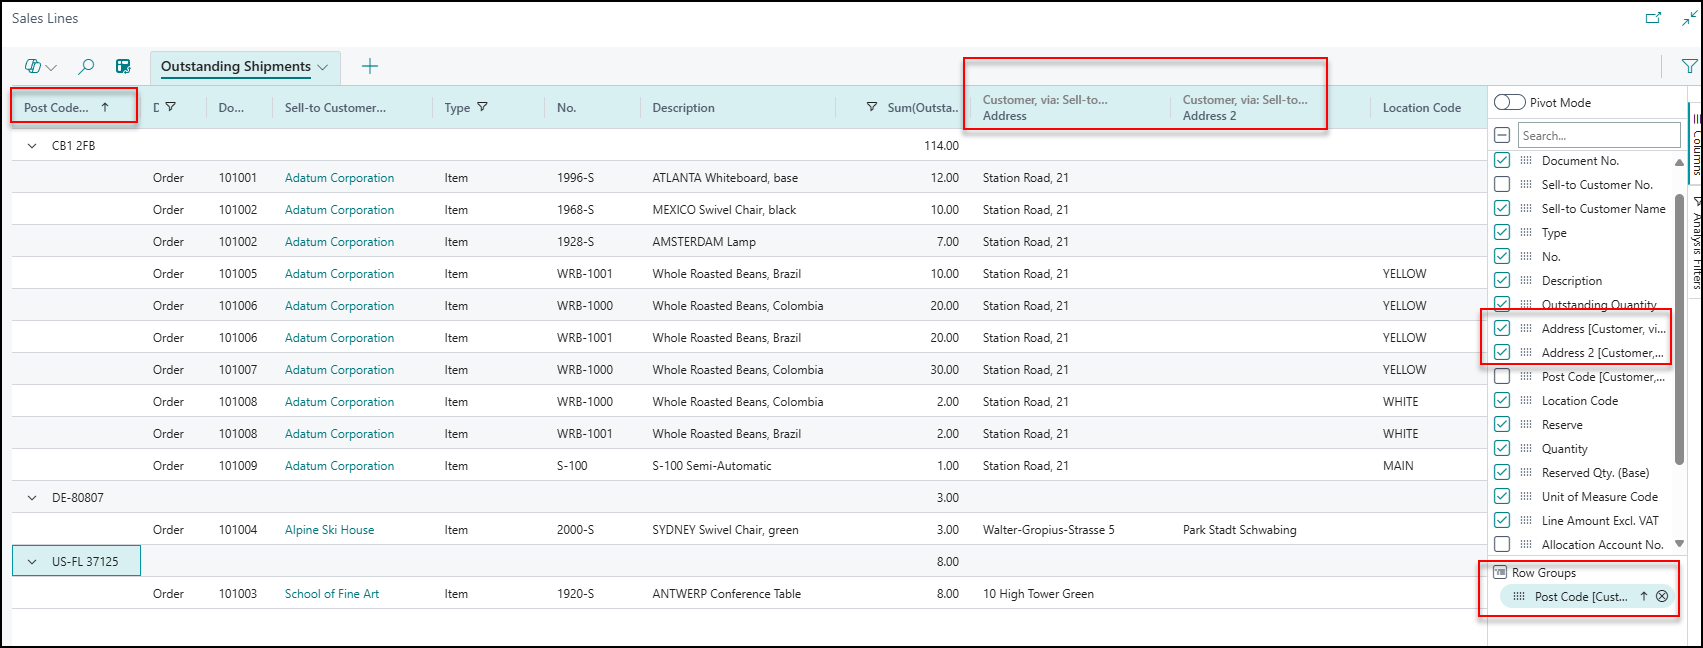
(Note: this might need extra work if using multiple Ship-to addresses.)
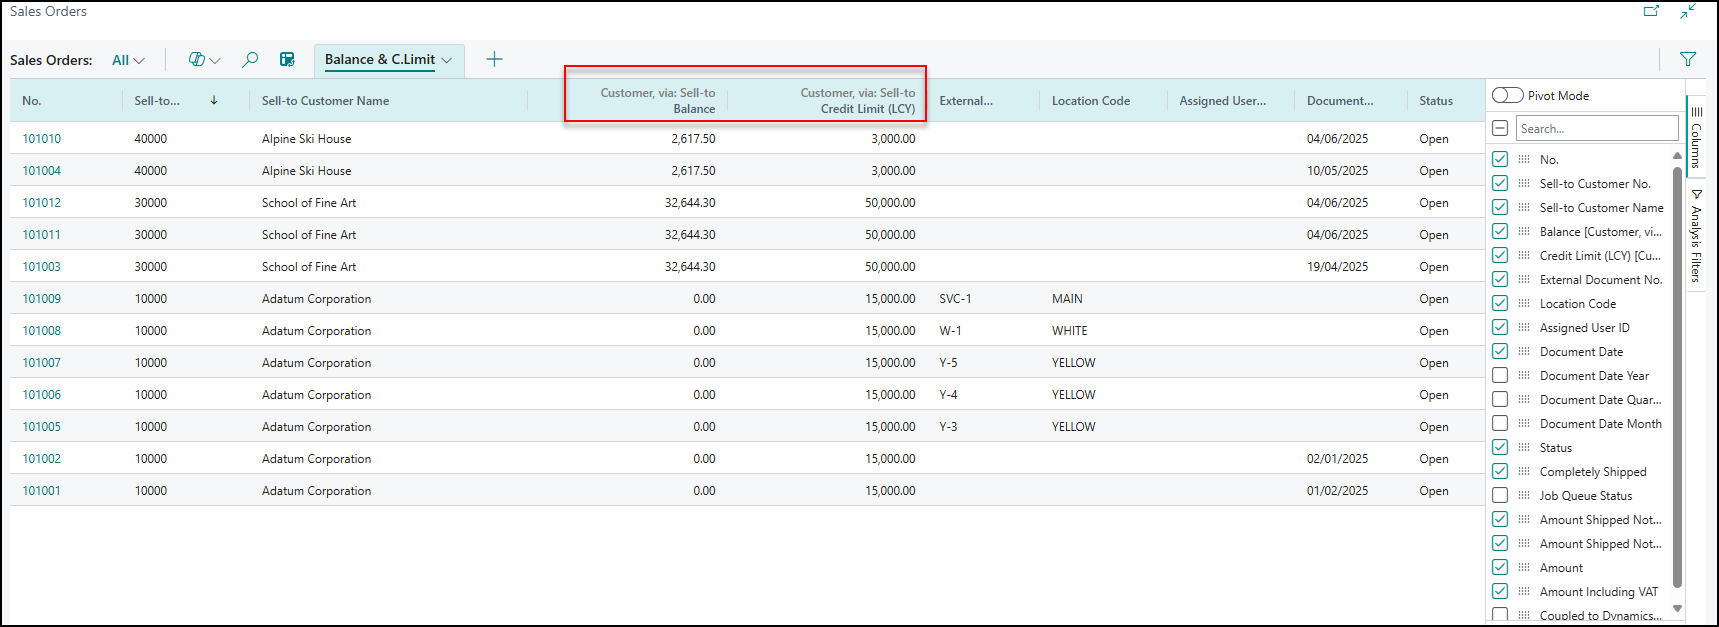
On the Sales Orders page, I’ve added in from the Customer table the Balance LCY and Credit Limit, letting me easily see this data while working with orders (same can be done for invoices). Just watch out because groupings and sum fields for these can look odd because it will add them up!
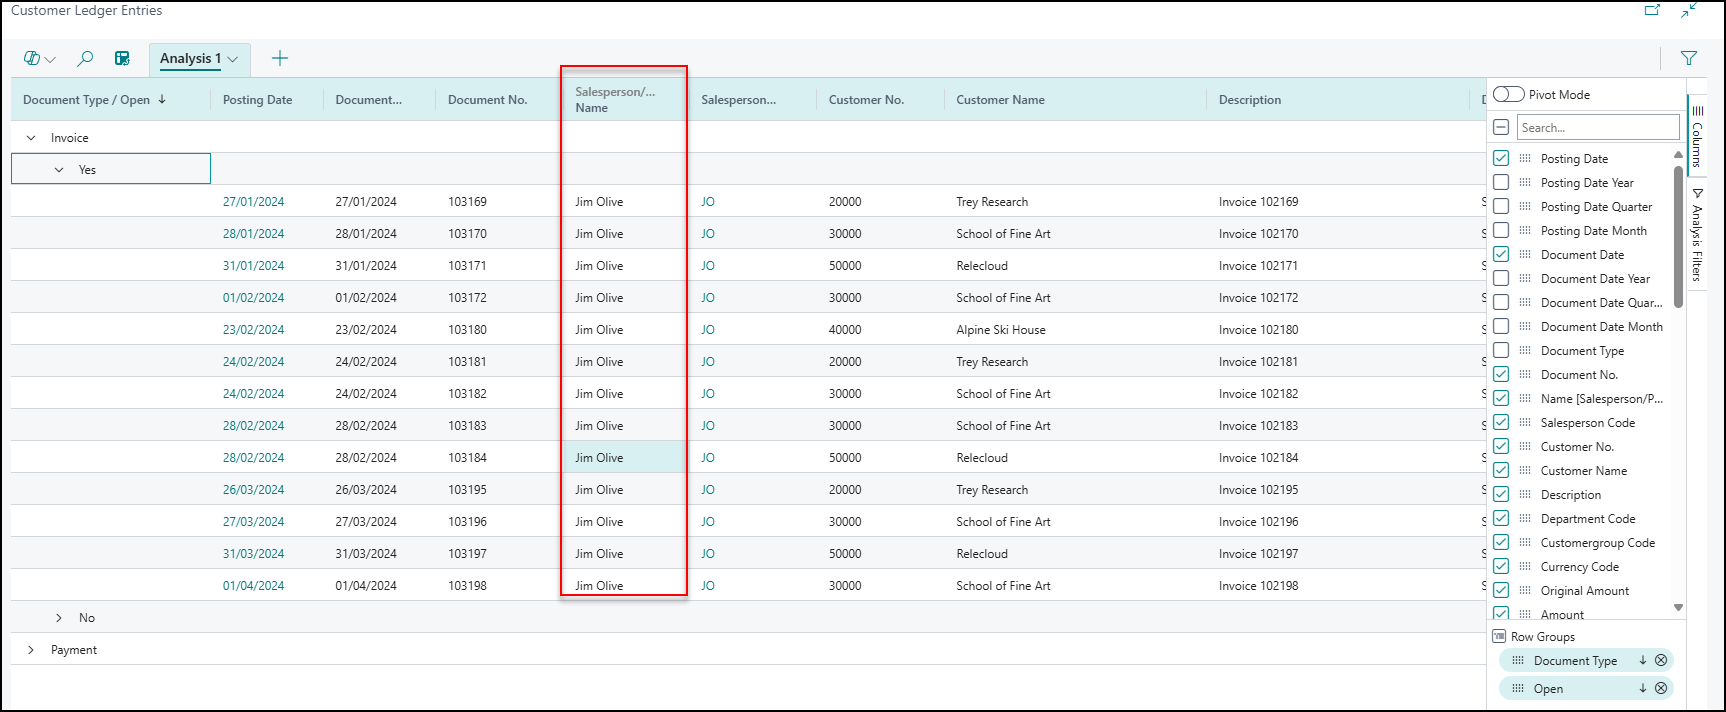
This is one you could do on many Sales/Purchase pages. We’ve added in Name from Salesperson/Purchaser, so that rather than just having a code, we have the actual individual’s name.
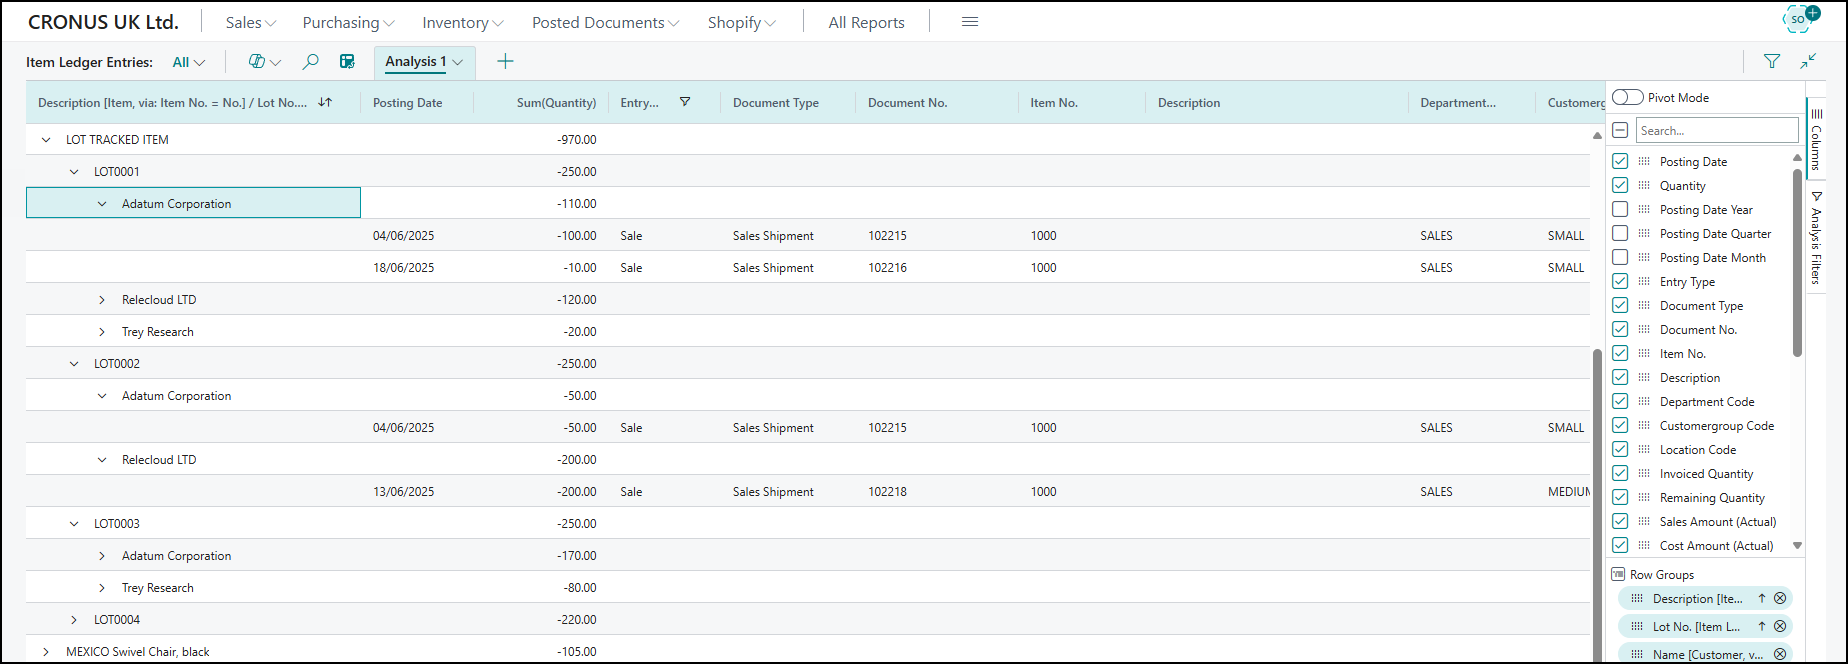
On the Item Ledger Entries page, we’ve added in a few fields.
We’ve then filtered to just entry type of sales. This lets us group and see what Lots we have shipped/sold to customers. We can also get the Shipment Document number from here, as well, if we need to inspect this. With a change of Lot Number to Serial Number or using Entry Types like Consumption, this makes it a good base for multiple ways of analysing where our items have been used/ended up. The grouping can also be switched around depending on how you want to view the data.
To watch how we put these together, take a look at our dedicated YouTube video on analysis enhancements.
Watch out for more tips like this on our blog and if you have any questions for us about how we can help your business, please get in touch today.